Confidence Intervals
Confidence Intervals for σ Known
Learning Objectives
In this section, we will examine the formulas to calculate
- The lower and upper limits confidence interval limits
- Margin of error
- Required sample size
- Examine when averages fail to forecast future data
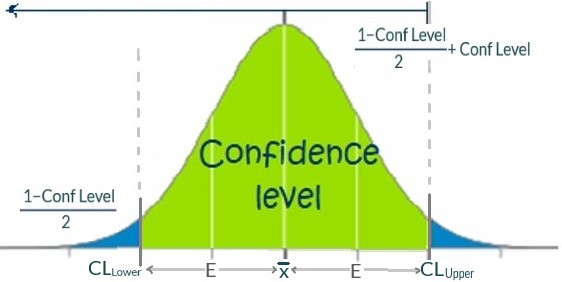
When the population standard deviation (σ) is known and we want to construct the interval estimate, or confidence interval for the true mean, μ, we use:
- [latex]CL_{Lower} = \bar{x} - z\cdot \frac{\sigma}{\sqrt{n}}[/latex]
- [latex]CL_{Upper} = \bar{x}+ z\cdot \frac{\sigma}{\sqrt{n}}[/latex]
These calculations will provide the lower and upper confidence limits respectively. Remember: [latex]\bar{x}[/latex] is the sample mean, [latex]\sigma[/latex] is the population standard deviation, [latex]z[/latex] is the [latex]z[/latex]-score related to a given confidence level and [latex]n[/latex] is the sample size.
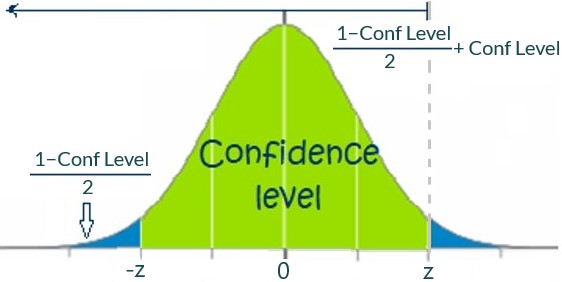
The negative and positive [latex]z[/latex]-score can be calculated using Excel's NORM.S.INV() function:
- [latex]-z = \text{NORM.S.INV}(\frac{1-\text{Conf level}}{2})[/latex]
- [latex]z = \text{NORM.S.INV}(\frac{1-\text{Conf level}}{2}+\text{Conf level})[/latex]
Margin of Error Formula
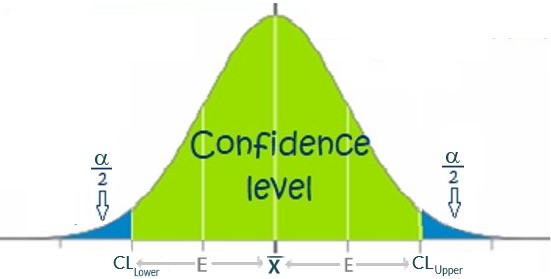
The margin of error (E) can be defined as the amount of random sampling error in the results of a survey. This is what we add and subtract from the sample mean (x̄) in the formulas above:
\[E = z\cdot \frac{\sigma}{\sqrt{n}}\]
It can also be considered as "how far off" the sample mean, x̄, could be from the true mean, μ, with a level of certainty equivalent to the confidence level.
We can also use an Excel's CONFIDENCE.NORM() function to calculate the Margin of Error directly: [latex]E = \text{CONFIDENCE.NORM}(\alpha, s, n)[/latex]. Where:
- [latex]\alpha = 1-\text{Confidence Level} = 100\%-\text{Confidence Level}[/latex]
- [latex]s =[/latex] sample standard deviation
- [latex]n =[/latex] sample size
Sample Size Formula
When we would like to determine how large of a sample to select to establish a maximum margin of error we use:
\[n = \left( \frac{z\cdot \sigma}{E}\right)^2\]
Note that you should always round your final answer up for [latex]n[/latex] to ensure that the margin of error does not exceed the desired error size (E).
Confidence Interval Calculation (Video)
In the example below, we will build up a confidence interval in the case where the population standard deviation (σ) is known.
Example 48.1.1
Problem Setup: Your boss wants you to forecast how many units of a certain type of EpiPen to order this month. You have recorded the monthly demand for the last 101 months. This demand has been recorded in the following spreadsheet. The following metrics were recorded for this data:
- Population standard deviation (σ) = 396.54
- Sample mean (x̄) = 927.762
- Sample size (n) = 101
Question: You want to find the range of units such that there is a 95% chance that the true average demand lies in this range. What are the limits for this interval?
Solutions: Click here to download the Excel solutions shown in the video below.
Conclusion: You can be 95% certain that the true average number of EpiPens demanded is between 850 and 1,005 pens per month. We will look at narrowing this range in the next section.
Click here to reveal the written solutions shown in the above video
In order to construct a 95% confidence interval when sigma in known, we first need to calculate the z-score(s). To do this, calculate the areas to the left of the z-score(s).
Calculating the area to the left of the limits
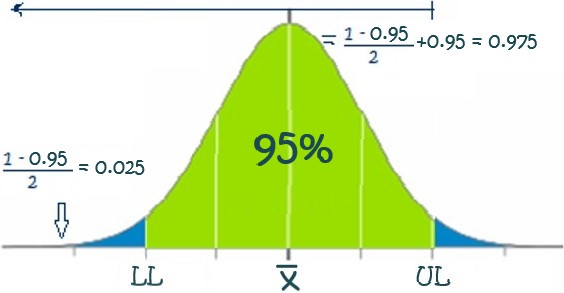
- [latex]\text{Area below LL} = \frac{1-0.95}{2}=0.025 = 2.5\%[/latex]
- [latex]\text{Area below UL} = \frac{1-0.95}{2}+0.95=0.975 = 97.5\%[/latex]
Calculating the Z-Scores
We can then use Excel's NORM.S.INV to calculate the z-score:
- NORM.S.INV(0.025) = −1.95996
- NORM.S.INV(0.975) = 1.95996
Using the Lower Limit Area
When using area to the left of the lower limit (2.5% in this case):
- We obtain a negative z-score.
- This is because we have obtained the z-score for the limit below the mean.
- Just drop the minus sign when using it in the confidence interval formulas
Using the Upper Limit Area
When using the area to the left of the upper limit (97.5%):
- We obtain a positive z-score
- It is the same in magnitude but opposite in sign of the lower limit's z-score
Calculating the Lower Limit
We use the following formula to calculate the lower limit:
[latex]\begin{align} CL_{Lower} &= \bar{x} - z\cdot \frac{\sigma}{\sqrt{n}} \\ &= 927.762 - 1.95996 \cdot \frac{396.54}{\sqrt{101}} \\ &= 850.428 \end{align}[/latex]
Calculating the Upper Limit
We use the following formula to calculate the upper limit:
[latex]\begin{align} CL_{Lower} &= \bar{x} + z\cdot \frac{\sigma}{\sqrt{n}} \\ &= 927.762 + 1.95996 \cdot \frac{396.54}{\sqrt{101}} \\ &= 1005.097 \end{align}[/latex]
Margin of Error
We can just calculate the margin of error:
\[E = z\cdot \frac{\sigma}{\sqrt{n}} = 1.95996\cdot \frac{396.54}{\sqrt{101}}=77.3347\]
Conclusions
We can be 95% certain that the true (population) mean, μ, is between 850.428 and 1,005.097.
Calculating Sample Sizes (Video)
As discussed above, sometimes, when we calculate a confidence interval, the range is very wide. We can calculate the sample size required to reduce the width of this interval by calculating. We will examine this concept in the example below.
Example 48.1.2
Problem Setup: Your boss asks you to improve your forecast for the average demand by narrowing the 95% confidence interval for the true mean monthly demand. Your boss wants your maximum sampling error (margin of error) to be 5 units.
Question: What sample size would be required to be sure your margin of error is at most 5 units?
Solution: Click here to download the Excel solutions shown in the video below.
Conclusion: You will need to collect demands from 24,162 months (or if you were collecting the data all from one location, this would be 2,000 years of data)! See the next section for comments on how using confidence intervals might not be the best approach to get approximate demand ranges for your boss.
Click here to reveal WRitten Solutions shown in the video above
In order to calculate the sample size, we use the following formula:
\[n = \left( \frac{z\cdot \sigma}{E}\right)^2 = \left( \frac{1.95996\cdot 396.54}{5}\right)^2 = 24,161.9 \approx 24,162 \]
This is an incredibly large required sample size! We will explore why this is so large and what can possibly be done in the following section.
