One Variable Hypothesis Testing
An Intro to Hypothesis Testing & Error Types
Learning Objectives
In this section we will
- Introduce hypothesis testing
- Explain what Type I and Type II Errors are
In this first section, we will leave out numeric values in our problems and simply try to discuss the general idea behind hypothesis testing.
What is Hypothesis Testing?
The question we look to answer for hypothesis testing is if a population has a specific population parameter (μ or p), what is the probability that the sample drawn came from that population?
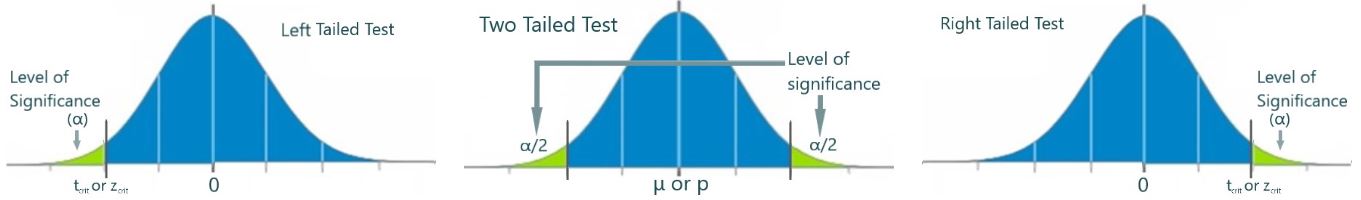
We ask ourselves if the stated true mean (μ) or proportion could not longer be true given the sample mean (x̄) or proportion (p̄) found. Ie: Does the sample statistic lie within the rejection region (highlighted region above) or not?
Comparing Hypothesis Testing to Confidence Intervals
When building a confidence interval, we attempt to estimate the true (population) parameter (μ or p) falling between limits with a determined probability.
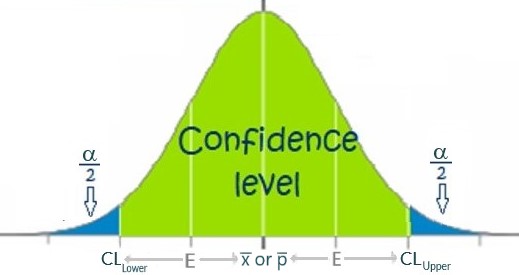
Ie: We ask ourselves what are the lower and upper limits such that we have a percent chance (equal to the Confidence Level) of the true mean (μ) or proportion (p) being in the confidence interval.
What-if Scenarios with Hypothesis Testing
Let us discuss a few ‘what-if’ questions regarding the hypothesis test diagrams. Let us assume that we know that the sample means are normally distributed around the true mean. Let us examine four possible scenarios for the sample mean (see x̄1 to x̄4 in Figure 55.3 below) . The question we will ask for each sample result – do we believe that this sample came from the population in question, whose true mean is μ?
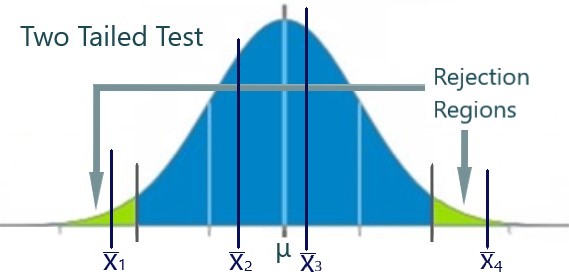
- For x̄1, we conclude ‘NO.’ The sample mean is too far from the true mean, μ. The sample mean is in the left-hand rejection region. We conclude that the sample mean does not likely come from the population whose true mean is μ.
- For x̄2, we conclude ‘YES.’ It is likely that the sample mean comes from the population whose true mean is μ.
- For x̄3, we conclude ‘YES.’ It is likely that the sample mean comes from the population whose true mean is μ.
- For x̄4, we conclude ‘NO.’ The sample mean is too far from the true mean, μ. The sample mean is in the right-hand rejection region. We conclude that the sample mean does not likely come from the population whose true mean is μ.
In the cases where we concluded ‘NO’, we can conclude that the sample mean most likely came a different population than the one in question. We will examine the implications of this conclusion in later sections also.
Type I and Type II Errors
Anytime we make decisions under uncertainty, there is always a likelihood that we can make an error in judgement. This is the basis of Type I and Type II Errors that are possible to occur when performing hypothesis testing.
| Null Hypothesis is TRUE | Null Hypothesis is FALSE | |
|---|---|---|
| Reject Null Hypothesis | Type I Error (False Positive) | Correct Outcome (True Positive) |
| Fail to reject Null Hypothesis | Correct Outcome (True Negative) | Type II Error (False Negative) |
Type I Error
We rejected the null hypothesis (that the sample result came from the population in question) but in fact, the sample result did come from the population in question. In other words, we concluded that the sample result did not come from the population in question when, in actual fact, it did come from the population in question. This is also called the ‘False Positive’ case.
Type II Error
We failed the null hypothesis (that the sample result came from the population in question) but in fact, the sample result did not come from the population in question. In other words, we concluded that the sample result came from the population in question when, in actual fact, it did not come from the population in question. This is also called the ‘False Negative’ case.
First Example of Type I and II Errors (Exercises)
Let us examine some examples of Type I and II errors in order to better understand them.
Example 55.1.1
Problem Setup: Let us suppose someone within your class is innocent of committing a crime. Suppose that this person is arrested and brought to trial. The jury discusses the evidence that is presented and comes to a verdict.
Question: What is the outcome based on the verdict?
You Try: Select the correct outcome per scenario below. Scroll to view the different scenarios.
Click here to reveal the solutions to the above exercise
- When your classmate was found not guilty, the jury correctly failed to reject the null hypothesis of innocence. This is CORRECT and is the true negative.
- When your classmate was found guilty, the jury falsely rejected the null hypothesis of innocence. This is incorrect and is a false positive.
Note: People are assumed innocent until proven guilty. This means, there must be enough evidence to conclude ‘beyond a reasonable doubt’ that they reject that the person can be from the innocent population. If they find the overwhelming evidence (or sample results) that are so far from what a innocent person would do, then they can reject that the person is from the innocent population (that the person is innocent).
Example 55.1.2
Problem Setup: Suppose, instead, that your classmate did indeed convict the crime that they are accused of.
Question: What is the outcome based on the verdict?
You Try: Select the correct outcome per scenario below. Scroll to view the different scenarios.
Click here to reveal the solutions to the above exercise
- This is a false negative. They failed to reject the null hypothesis of innocence and concluded that there is not enough evidence to conclude that your classmate is guilty.
- This is a true positive. The jury correctly rejected the null hypothesis of innocence and concluded that your classmate is guilty (not innocent).
Second Example of Type I and II Errors (Exercises)
Let us now examine an example closer to you! in this class called ‘statistics’, you need ot demonstrate a certain level of competence in order to move to the next level. We use a series of evidence collection devices called ‘quizzes’, ‘tests’ and ‘exams’ that are designed to measure this level of competence.
There are two ways of defining the base or ‘true’ population. For the purpose of this example, let us declare the ‘true population’ as incompetence. Ie: we will assume a student is ‘incompetent’ unless they score high enough away from zero on the test to conclude that they are competent.
We could have defined our base or ‘true’ population as the opposite and assumed that a student is competent unless they score far enough below 100% to be determined ‘incompetent.’ Both scenarios are just as correct. We just need to pick one.
Again, we will assume our true population is ‘incompetence’ unless a student demonstrates a high enough competency by scoring well above 0% on the test.
Example 55.2
Problem Setup: Let us suppose you are competent in Statistics. You work hard, study hard and have a good grasp of the content. You write your midterm and get your grade back.
Question: What is the outcome based on your result?
You Try: Select the correct outcome per scenario below. Scroll to view the different scenarios.
Click here to reveal the solutions to the above exercise
- This scenario is a true positive. The ‘true’ population is incompetence. Incompetence should be rejected if there is overwhelming evidence that the person is competent. That is the case in this scenario. You are competent and the assumption of being incompetent has been rejected due to your test score.
- This scenario is a False negative (Type II Error). The ‘true’ population is incompetence. Incompetence should be rejected if there is overwhelming evidence that the person is competent. That is not the case in this scenario. You are competent and the assumption of being incompetent has not been rejected due to your test score.
