Chi-Squared Test of Independence
This chapter will present the [latex]\chi^2[/latex] (Chi-Square) test for independence.
When do we use the test?
It is useful to:
- determine if there is a difference between 2 or more population proportions
- determine if two or more categorical variables are dependent on each other χ
If two variables are dependent, the probability of one variable having a certain value (or belonging to a certain category) is dependent on the other variable having a certain value (or belonging to a certain category).
Comparing χ2 to the Difference in Two Proportions Test
- In the test for the difference in proportions, we test if there is a difference in two population proportions for two different groups/samples
- In the Chi-Squared (χ2) test, we are testing if there is a relationship two populations and their characteristics.
- In the test for the difference in proportions, we can possibly know if one population proportion is higher, lower or not equal to the other one.
- In the Chi-Squared (χ2) test, if there is a relationship between populations and characteristics (there is a dependence), we can't know the nature of the relationship.
- In the test for the difference in proportions, we only test the proportion in each population with one characteristic (and determine if it is different between populations)
- In the Chi-Squared (χ2) test, there can be more than two categories/characteristics in each group and we test if there is some relationship between at least one characteristic and the populations.
What is χ2 (Chi-Squared)?
Like in previous sections, we will be using a certain continuous distribution, called the χ2 (Chi-Squared) distribution to compute probabilities. In our case, the probability will be associated with the probability of getting the sample result we did when there is no dependence between the categorical variables in question.
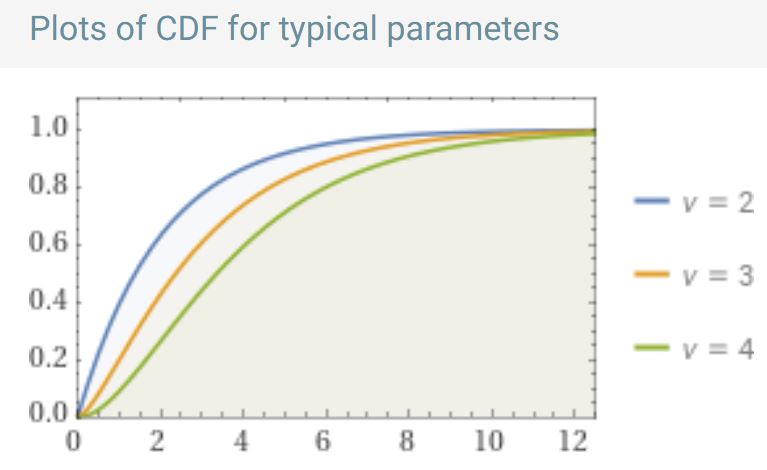
The cumulative density functions for the χ2 distribution are shown above for several degrees of freedom (ν). We will review degrees of freedom for this distribution in the next section.
Parameters of Chi-Squared Distribution
Like other distributions, we can define certain parameters for the χ2 distribution:
- [latex]\nu[/latex] = degrees of freedom (to be defined in the next section)
- Mean = [latex]\nu[/latex]
- Mode = [latex]\nu[/latex] (only when ν < 2)
- Standard deviation =[latex]\sqrt{2\nu}[/latex]
- Variance = [latex]2\nu[/latex]
- Skewness = [latex]2\sqrt{\frac{2}{\nu}}[/latex]
