Hypothesis Tests to Compare Two Population Means
Pooled and UnPooled Variance Tests
Learning Objectives
This section review the following learning objectives.
- Determine which test to use (Pooled or Unpooled) Variance t-Test
- Use Excel's Data Analysis Toolpak to calculate values in the test
- Draw conclusions based off of the test results
Let us first recap what types of scenarios where we used a Pooled Variance t-Test to test for differences in two population means:
- We have two independent samples
- The standard deviation of one of the samples is less than double the other sample
- The variance of one of the samples is less than four times the variance of the other sample
Determining which Test to Use
Let us revisit the example from the previous section but put a different 'spin' on it. This will, hopefully, help you understand the difference between paired and independent samples.
Example 64.1
Problem Setup: One hundred suitable individuals who needed to take a statin to lower their cholesterol were selected at random.
- They were given 'Brand X's statin medication
- Their levels were initially recorded (for a 'baseline' measurement).
- Their levels were recorded after six months of taking the medication.
Another one hundred individuals who needed take a statin were selected at random.
- They were given 'Brand Y's statin medication
- Their levels were initially recorded (for a 'baseline' measurement).
- Their levels were recorded after six months of taking the medication.
Click here to download their before, after levels and the difference in levels. The sample standard deviation for the brands' differences between baseline and post-meds levels are given below:
| Statistic | Brand X | Brand Y |
|---|---|---|
| Standard Deviation | 78.8395 | 69.1039 |
Question: Which test should we use if we want to test if there is a difference between the average decrease in levels between the two brands?
Solution: We need to examine how 'different' the standard deviation or variances are between the two brands' decrease in levels:
[latex]\frac{\text{st dev}_X}{\text{st dev}_Y} = \frac{78.8395}{69.1039} = 1.14 < 2[/latex]
Because the one brand's standard deviation is less than double the other's, then we can use a Pooled Variance Test. Note: It is easiest to place the larger standard deviation on the top of the fraction and always compare to two:
- If the ratio is smaller than 2 — use a pooled variance test.
- If the ratio is larger than 2 — use an unpooled variance test.
Setting up the Hypotheses
Let us now setup the hypotheses for this problem in the next example.
Example 64.2
Problem Setup: Let us revisit Example 64.1's problem. We want to decide if there is a difference in the effectiveness in dropping cholesterol levels in the two brands.
Question: What are the null and alternate hypotheses for this problem?
Solution: Let us examine the differences between the 'Decrease in Level' values for the two brands. Let us call the brand X's true average decrease in cholesterol μd_x. Let us call the brand Y's true average decrease in cholesterol μd_y. This gives:
H0: μd_x = μd_y or μd_x − μd_y = 0
HA: μd_x ≠ μd_y or μd_x − μd_y ≠ 0
Using Excel's Data Analysis Toolpak
Let us continue with Example 64.2. In this section, we will step through how to use Excel's Data Analysis Toolpak to calculate the required metrics for this question.
Example 64.3
Problem Setup: Continue with Example 64.2. We want to decide if there is a difference in the effectiveness in dropping cholesterol levels in the two brands. In this example, pick the correct test within the Data Analysis Toolpak and then run this test to determine the following metrics:
- The test statistic (ttest)
- The p-value for correct tail
- The critical value (tcrit)
Solutions: Click here to download the solutions shown in the video or click to reveal the step-by-step instructions below.
Step-by-Step Solutions
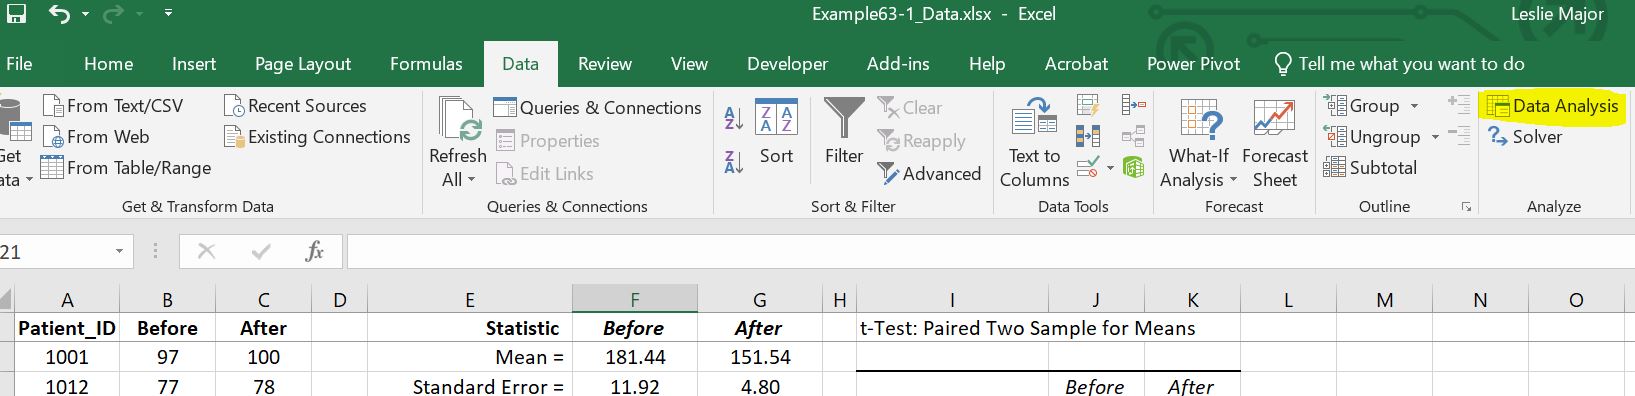
- Click on the 'Data' tab and select 'Data Analysis'
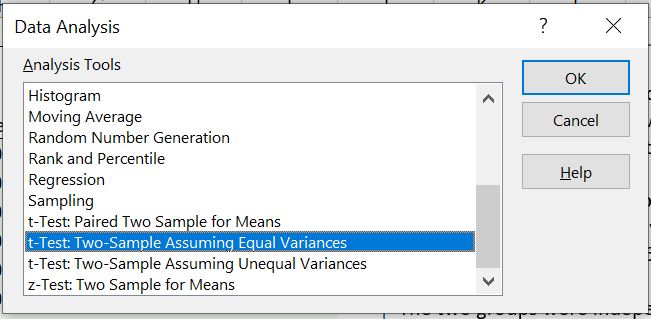
- Select 't-test: Two-Sample Assuming Equal Variances and click 'OK'
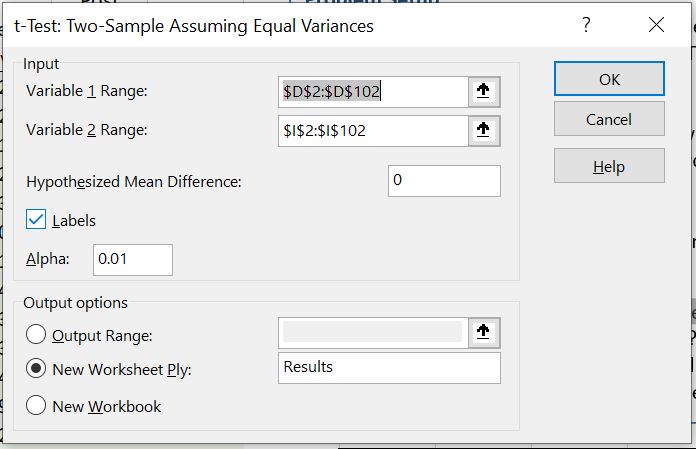
- Put the following inputs in the t-test dialogue box:
- Select brand X's 'Decrease in Level' as Variable 1.
- Select brand Y's 'Decrease in Level' as Variable 2.
- Set the Hypothesized Mean Difference to 0.
- Check off Labels.
- Enter 0.01 for Alpha (this is the level of significance)
- Select an 'Output Range' (either somewhere in the worksheet or a new worksheet)
- Click 'OK'
The following outputs should be given:
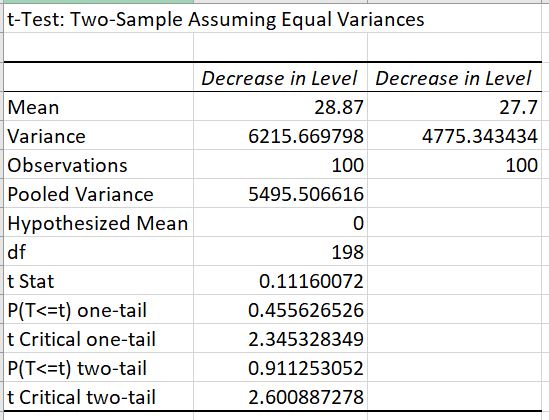
The Decision and Conclusion
So how do we interpret the output given by the Data Analysis Toolpak? Let us form a conclusion based off the output given in the previous section.
Example 64.4
Problem Setup: Continue with Example 64.3. Interpret the Excel output given in that example (see below).
Question: What are your decision and conclusion based on the above output?
Solutions: We are performing a two-tailed test. Therefore, read the P(T<=t) two-tail line to determine the p-value.
- Decision: Fail to reject H0 at the 1% level of significance
- Reasoning: The p-value = 0.91125 is greater than (>) the level of significance (0.01)
- Conclusion: There is not sufficient evidence to conclude one brand's average decrease in cholesterol levels is different from the other brand's decrease in level.
UnPooled Variance Test Case
Let us continue slightly change up Example 64.1 to help us better understand the difference between pooled an unpooled variance tests.
Example 64.5
Problem Setup: Let us continue with example 64.5. In this, however, let assume the following to be true of the standard deviations for brand X's and brand Y's decrease in cholesterol levels:
| Statistic | Brand X | Brand Y |
|---|---|---|
| Standard Deviation | 78.8395 | 169.1039 |
Question: Which test should we use if we want to test if there is a difference between the average decrease in levels between the two brands?
Solution: We need to examine how 'different' the standard deviation or variances are between the two brands' decrease in levels. Since Brand Y has a higher standard deviation, let us place its value on the top of the fraction:
[latex]\frac{\text{st dev}_Y}{\text{st dev}_X} = \frac{169.1039}{78.8395} = 2.1449 > 2[/latex]
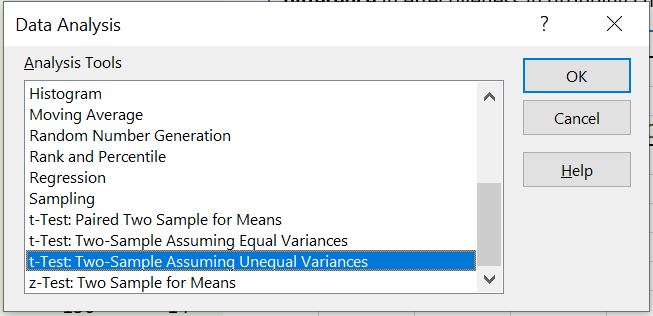
Because the one brand's standard deviation is more than double the other's, then we can use an Unpooled Variance Test. Note: It is easiest to place the larger standard deviation on the top of the fraction and always compare to two:
- If the ratio is smaller than 2 — use a pooled variance test.
- If the ratio is larger than 2 — use an unpooled variance test.
To perform this test in Excel, all the steps are identical with the exception that you choose 'Two-Sample Assuming Unequal Variances':