One Variable Hypothesis Testing
Hypothesis Testing for One Proportion
Learning Objectives
In this section, we will step through several examples of how to perform hypothesis testing for sample proportions. First, let us recap the required formulas from the Hypothesis Steps section:
Hypotheses
H0: [latex]p = p_{original}[/latex] (all tails)
HA: [latex]p < p_{original}[/latex] (left-tailed), [latex]p > p_{original}[/latex] (right-tailed), [latex]p \neq p_{original}[/latex] (two-tailed)
Test Statistic
The test statistic formula is the same, regardless of what tailed test we are performing: \[z_{test} = \frac{\bar{p}-p}{\sqrt{\frac{p(1-p)}{n}}} \]
P-Values
We use Excel's NORM.S.DIST() function to calculate all p-values:
\[p_{\text{ left-tailed}}=\text{NORM.S.DIST}(z_{test},\text{TRUE})\]
\[p_{\text{ two-tailed & z < 0}}=2\times\text{NORM.S.DIST}(z_{test},\text{TRUE}) \]
\[p_{\text{ two-tailed & z > 0}}=2\times(1-\text{NORM.S.DIST}(z_{test},\text{TRUE})) \]
\[p_{\text{ right-tailed}}=1-\text{NORM.S.DIST}(z_{test},\text{TRUE}) \]
Remember: For two-tailed tests, we double the area outside of the z[latex]_{test}[/latex] score to account for the fact that we are interested in either tail (the left or right tail). We double the area beyond the test statistic to account for this.
Click-Through Rates Right-tailed Test (Excel Solutions VIDEO)
In this section, we will have an ad campaign being run on the Google Ads Search Network. We will ask if there has been a change in the Click-Through Rates based on a change to the ad. We will use a right-tailed hypothesis test to perform this test. Before we jump into the example, let us first discuss Click-Through Rates (CTR).
Click-Through Rates (CTR)
What is a Click-Through Rate (CTR)? It is the percentage of time the person clicks through to a website, whether they click on your ad, click on website brought up in a search, etc. It can be defined as the ratio of clicks to impressions.
\[CTR = \frac{\text{Number of Clicks}}{\text{Number of Impressions}}\times 100\% \]
Note: An impression is a 'view' of the ad, search suggestion or video in question.
Example 58.1
Problem Setup: You and your marketing team are running an ad on Google Ad's Search Network. The campaign has had a Click-Through Rate of 1.91% until recently. You recently enabled your ad to appear on Google's search partners in addition to searches on Google itself. You believe this change has created an increased Click-Through Rate.

Your Google Ads account, since the change, shows 77 clicks-through on 3054 impressions.
Question: Is there sufficient evidence, at the 5% level of significance, to conclude that turning on the feature to allow your ad to also be seen via Google's search partners increased the Click-Through Rate?
Solutions: Click here to download the Excel solutions and click on the sections below to reveal the written solutions shown in the above video.
Assumptions
For proportions, there is a slightly different set of criteria for a large enough sample size. The sample size needs to be large enough such that:
- [latex]n\times p > 5[/latex]
- [latex]n\times (1-p) > 5[/latex]
If the above criteria are satisfied, the mean of the distribution of the sample proportions, denoted μp , equals the population proportion. In addition, the distribution of the sample proportion is approximately normal.
Hypotheses
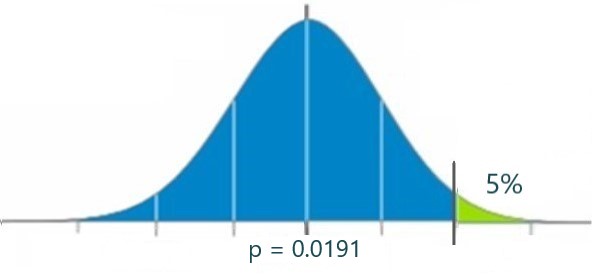
- H0: p = 0.0191
- HA: p > 0.0191
Rejection Region
We want to prove that the click-through rate (CTR) is now higher than 1.91%. For this reason, we need our sample result to be significantly higher than 1.91%. The rejection region would be the upper 5% right tail. The original proportion of 1.91% is what we are comparing to and is marked in the middle of the graph.
Type of Test
This is a right-tailed test. In order to prove that the click-through rate (CTR) is now higher than 1.91%, we will need our sample result to be far enough above the original rate of 1.91% and be, therefore, in the upper right tail (upper rejection region).
Test Statistic
In order to calculate the test statistic, we need to first calculate the sample proportion:
[latex]\bar{p}=\frac{\bar{x}}{n}=\frac{77}{3054} =0.0252 = 2.52\%[/latex]
We can now use the sample proportion to calculate the test statistic:
[latex]\begin{align} z_{test} = \frac{\bar{p}-p}{\sqrt{\frac{p(1-p)}{n}}} &= \frac{0.0252-0.0191}{\sqrt{\frac{0.0191(1-0.0191)}{3054}}} \\ &= \frac{0.006113}{0.002477}= 2.4680 \end{align}[/latex]
P-value
Because we are performing a right-tailed test on a mean, we will use Excel's NORM.S.DIST.(ztest, 1) function:
[latex]p\text{-value}=\text{NORM.S.DIST}(2.4680, 1) = 0.0068[/latex]
Decision
We can see, in the figure below, that the test result of 2.52% lies far within the rejection region:
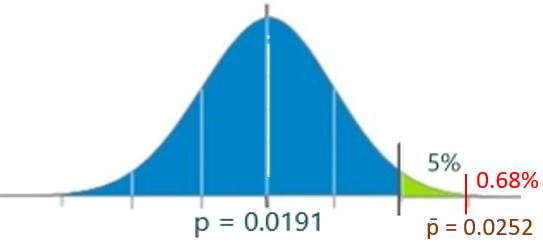
This means that the p-value (0.68%) is less than the level of significance of (5%) and we should reject H0.
Conclusion
Because we rejected H0, there is sufficient evidence to conclude that turning on the feature to allow your ad to also be seen via Google's search partners increased the Click-Through Rate.
Quality COntrol Left-tailed Test (Written Solutions Video)
In this example, we will perform a left-tailed hypothesis test for a sample with one proportion. We will return to our example of quality control for space fasteners that could be supplied to organizations and companies like NASA, SpaceX and other companies that build satellites and other machines used in space.
 |
 |
Example 58.2
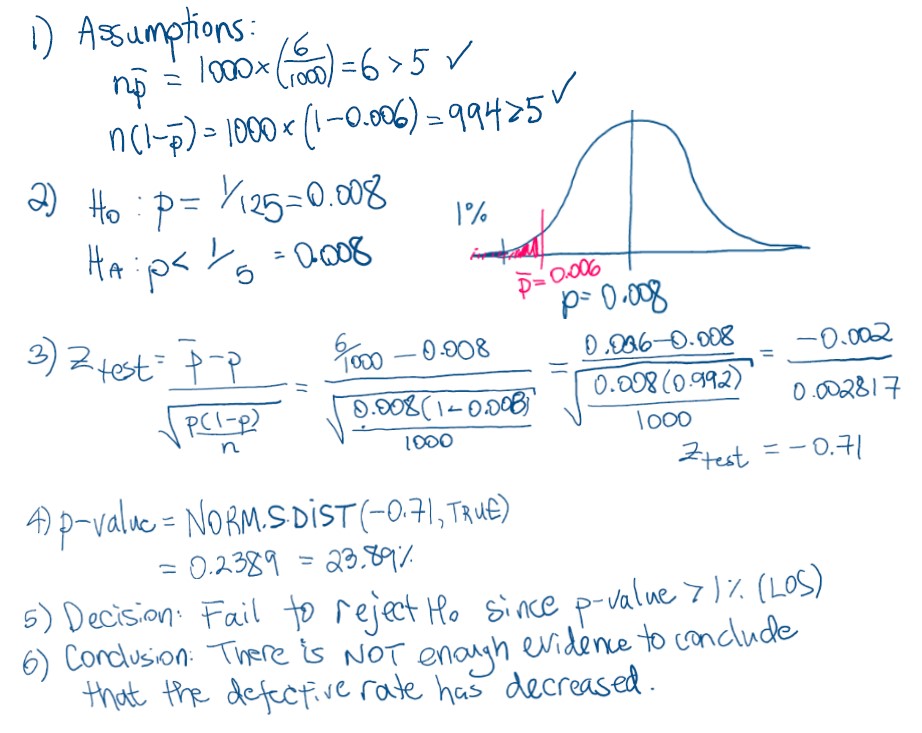
Problem Setup: A company supplies Standard Hexagon Head Cap Screws. They have recently upgraded their machines and believe that they have decreased the percent of screws deemed as "defective." Historically, they would have 1 out of 125 screws deemed as 'defective.'

Question: Since replacing their machines, they sampled 1,000 screws and found that 6 were defective. At the 1% level of significance, is there sufficient evidence to conclude that the percent of defective screws has decreased since replacing their machines?
Solutions: Click here to download the written solutions shown in the video below. Click here to download the Excel solutions.
Conclusion: Because we failed to reject H0, there is not sufficient evidence to conclude that the percent of defective screws has decreased since replacing the machines in the production plant. Perhaps we can conclude that the money could have better been spent on improving other processes/machinery in the plant?
Written Solutions (click to Reveal)
Polling Votes Two-tailed Test (Exercise)
In this example, we will look at polling votes for an election example. We will perform a two-tailed proportion test.
Example 58.3
Problem Setup: Abacus Pollsters polls the electorate before the next election. Previous to the poll, it was forecasted that 28% of the electorate would vote for the Canada Party in the upcoming election. They poll 1,200 people and find that 282 people responded that they planned to vote for the Canada Party in the upcoming election.

Question: Is there sufficient evidence, at the 5% level of significance, to conclude that the percent of people forecasted to vote for the Canada Party has changed?
You Try: Scroll through the questions below to solve the hypothesis test problem above.
Solutions: Click here to download the Excel solutions to the above exercise.
