Measures of Variance
The Standard Deviation
Learning Objectives
Calculate and understand the sample and population standard deviations.
The Standard Deviation (St. Dev.):
- Is the average distance that the numbers are away from the mean.
- I.e., the average of [latex](x_i-\bar{x})[/latex].
- It takes into account ALL the numbers when calculating the 'spread' of the data.
- Is a good measure of dispersion of data.
The SAMPLE standard deviation is defined as:
\[s = \sqrt{\frac{\Sigma(x_i-\bar{x})^2}{n-1}}\]
The POPULATION standard deviation (indicated by σ, the LOWER case SIGMA) is given by:
\[\sigma= \sqrt{\frac{\Sigma(x_i-\mu)^2}{N}}\]
Example 6.1.1 - Sunita's Grades
Let us go back to look at Sunita's and Sanjay's grades from a couple of sections back:
| Name | Homework | Term Test#1 | Term Test#2 | Term Test#3 | Concept Quizzes |
|---|---|---|---|---|---|
| Sunita | 80 | 80 | 80 | 82 | 83 |
| Sanjay | 48 | 80 | 80 | 98 | 99 |
- Remember, Sunita's average grade was 405/5 = 81 and her median grade was 80.
- The range for Sunita's grades = [latex]83 - 80 = 3[/latex].
- Sunita's range is small because ALL the numbers are close to the mean of 81.
- We will regard this data as a sample, and therefore we will talk about [latex]\bar{x}[/latex]and [latex]s[/latex].
Let us work Sunita's standard deviation of her grades. It is easiest if we put it in the following table:
| [latex]x_i[/latex] | [latex]\bar{x}[/latex] | [latex](x_i -\bar{x})[/latex] | [latex](x_i-\bar{x})^2[/latex] |
|---|---|---|---|
| 80 | 81 | -1 | 1 |
| 80 | 81 | -1 | 1 |
| 80 | 81 | -1 | 1 |
| 82 | 81 | 1 | 1 |
| 83 | 81 | 2 | 4 |
| SUM | [latex]\Sigma = 8[/latex] |
This gives the following standard deviation for Sunita's grades:
\[s = \sqrt{\frac{\Sigma (x_i-\bar{x})^2}{n-1}} = \sqrt{\frac{8}{5-1}}=\sqrt{2}=1.41\]
Example 6.1.2 - Sanjay's Vs. Sunita's Grades (Excel)
Now, let us go back to look at Sanjay's grades:
- For Sanjay, the range= [latex]99 - 48 = 51[/latex].
- Sanjay's range is large because SOME of the numbers are not so very close to the mean of 81.
Let us calculate Sanjay's standard deviation in Excel and compare it to Sunita's standard deviation:
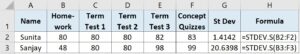
- We see that the standard deviation of Sanjay's grades is much higher.
- Ie: Sanjay's grades have a larger deviation, on average, from the average grade of 81.
- Click here to download the spreadsheet shown above
Key Takeaways
Key Takeaways: The Standard Deviation
- When the standard deviation is small, the numbers are close to the mean.
- When the standard deviation is large, some of the numbers are not close to the mean.
- It measures the average distance that the numbers are away from the mean.
- There are different formulas for the sample and population standard deviation.
- Often, we assume that we have a sample (if nothing is stated).
Your Own Notes
- Are there any notes you want to take from this section? Is there anything you'd like to copy and paste below?
- These notes are for you only (they will not be stored anywhere)
- Make sure to download them at the end to use as a reference
