Sampling
Sample Versus Population Metrics
Learning Objectives
In this section, you will learn:
- Why it matters to differentiate between samples and populations
- Some population and sample parameters of interest
- When sampling should be used
- The difference between a sample and a census
- How to measure population characteristics using sampling
Sample vs Population
Up to this point in time, it really has not mattered if we were dealing with a sample or a population. The only difference in this course so far has been:
- when calculating the standard deviation
- there were different formulas for calculating the standard deviation of a population
- compared to calculating the standard deviation of a sample.
Why it Matters to Differentiate Samples and Populations
It matters that we differentiate between sample and populations because of three important reasons:
- You will be working with problems that contain information about the sample and the population.
- If you don't clearly distinguish between the two, you can't possibly be successful solving the problems.
- If you don't distinguish the two elements, you probably don't really understand why we're solving the problem in the first place!
Population and Sample Parameters
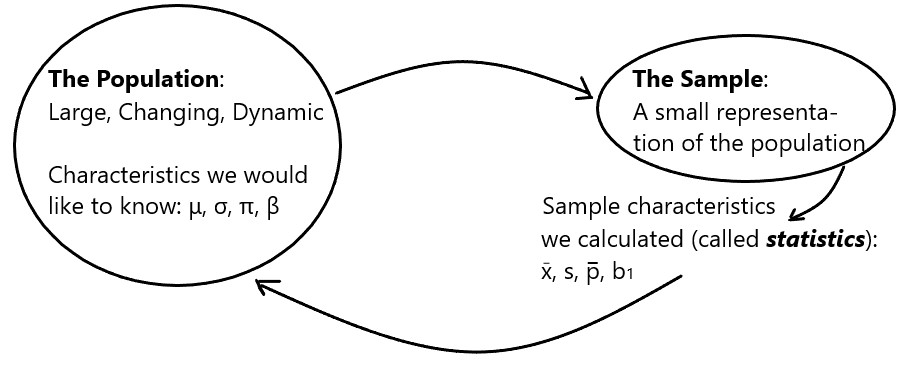
Figure 43.1 below illustrates conceptually what we're trying to do with sampling:
- The large circle on the left depicts the population (these are things we really want to know).
- The symbols inside represent population characteristics or population parameters (these represent characteristics of the population and are considered to be the truth of the population)
- For example, what do BCIT students really think about something? Do they really believe that Global Warming is a problem or not?
Population Characteristics of Interest
Some population characteristics that we are interested in include:
- the population mean: [latex]\mu[/latex] (stated as "mu")
- the population standard deviation: [latex]\sigma[/latex] (stated as "sigma")
- the population slope: [latex]\beta[/latex] (stated as "beta")
- the population percentage: [latex]\pi[/latex] (stated as "pie")
In the situation where the population is rather small:
- It may be possible to measure such characteristics directly.
- But this is not where sampling is used.
Sample Characteristics Recorded
The most common sample metrics or (statistics) that we will record are:
- the sample mean: [latex]\overline{x}[/latex] (stated as "x-bar")
- the sample standard deviation: [latex]s[/latex]
- the sample slope: [latex]b_1[/latex]
- the sample percentage: [latex]\overline{p}[/latex] (stated as "p-bar")
When is Sampling Used?
For large populations
- We might not have the resources to collect data from the entire population.
- It is especially problematic if the population is also dynamic in nature.
- Even if we did have the resources to measure the entire population, by the time we finished measuring it, the population has already changed!
Example of Large and Dynamic Population
Our previous Global Warming example would be relevant:
- If we did speak to everyone at BCIT about their belief in global warming,
- By the time we finished collecting all the data,
- It is quite possible that opinions have changed.
When to Sample
For the reasons discussed above, sampling is a technique which is applied to study and measure characteristics of populations whereby the population itself is typical large and changing in nature.
Census vs Sample
"While a census is an attempt to gather information about every member of the population, sampling gathers information only about a part, the sample, to represent the whole. Because a sample is only part of the population, we can study it more extensively than we can all of the members of the population."
How to Measure Population Characteristics Using Sampling
So how do we measure population characteristics using sampling?
- First extract a portion of the data from the population (i.e., a representative truly random and unbiased sample). This is depicted by the arrow and smaller circle in Figure 43.1 that illustrates a representative sample from the population.
- Next, we calculate the sample characteristics (called "statistics") that we're interested in.
- Once we have the statistics we must close the loop (as shown in Figure 43.1) and use our statistics to "estimate" the population characteristics (i.e., parameters).
In other words, the statistics are not what we really want - that's what we have - so we must close the loop by using the statistics to understand what the population parameters are.
Estimating Population Parameters
The next several chapters of this textbook focus on what is called "Estimation." We will be using sampling statistics to estimate population parameters for means and proportions.
Key Takeaways (EXERCISE)
Key Takeaways: An Introduction to Sampling
Drag the words into the correct boxes for each section below:
Click the sections below to reveal the solutions to the above exercises
Your Own Notes (EXERCISE)
- Are there any notes you want to take from this section? Is there anything you'd like to copy and paste below?
- These notes are for you only (they will not be stored anywhere)
- Make sure to download them at the end to use as a reference
