Binomial Distributions
Binomial Probability Distributions
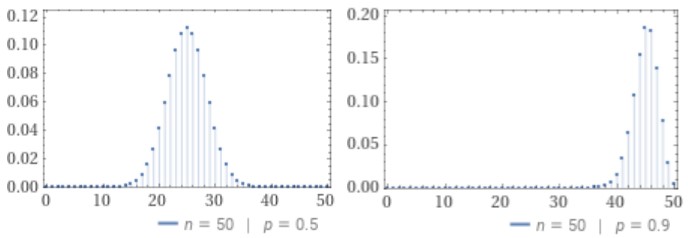
In this section, we examine Binomial Probability Distributions:
- They are discrete distributions
- They measure the probability of a certain number, [latex]x[/latex], of successes occurring
- We need both the number of trials ([latex]n[/latex]), and the probability of success ([latex]p[/latex]) to define a binomial distribution
The sections are organized as follows:
- An introduction, properties of Binomial Distributions and how to calculate the probability of exactly [latex]x[/latex] successes using the formula.
- How to calculate the probability of exactly [latex]x[/latex] successes using the Excel's =BINOM.DIST function.
- How to calculate the probability of at most [latex]x[/latex] number of successes.
- How to calculate the probability of more than [latex]x[/latex] number of successes.
- How to calculate the probability of at least [latex]x[/latex] successes or, [latex]P(X \ge x)[/latex].
- How to calculate the mean and standard deviation of binomial distributions.
