Continuous Uniform Distributions
Learning Objectives
Understand the shape, statistical properties and probability formula for continuous uniform distributions.
Continuous Distribution
A continuous uniform distribution is a 'continuous' distribution:
- Any value, [latex]x[/latex], between the lower [latex]a[/latex] and upper limit [latex]b[/latex] is possible
- It differs from 'discrete' distributions where only whole numbers are possible for [latex]x[/latex].
- See the graphs of uniform distributions with different min and max values below.
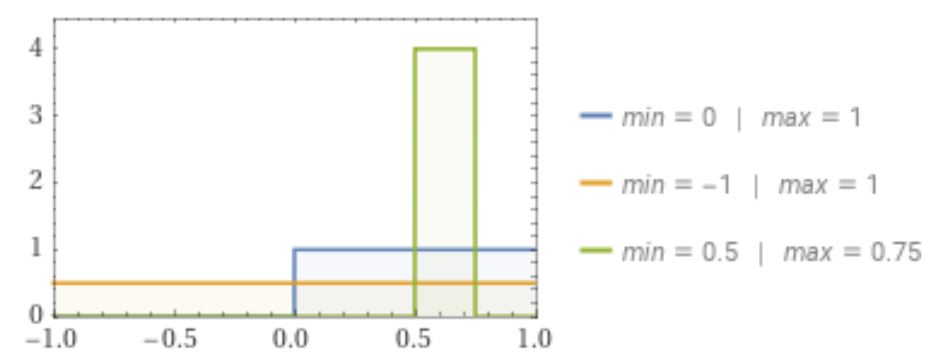
Equal Likelihood
- Uniform means "remaining the same at all times"
- We see from the above graph that the height, [latex]h[/latex], remains the same over each uniform distribution.
- This is due to the fact that there is equal likelihood of each value, [latex]x[/latex], occurring
- This gives each distribution the shape of a rectangle.
- Because of this and the fact that the total area of any probability distribution must equal to 1:
[latex](b-a) \times h = 1[/latex] or, [latex]h = \frac{1}{b-a}[/latex] - This gives an area (or probability) between two [latex]x[/latex]-values, [latex]x_1[/latex] and [latex]x_2[/latex]:
[latex]P(x_1 \le x \le x_2) = (x_2 - x_1) \times \frac{1}{b-a} = \frac{x_2 - x_1}{b-a}[/latex]
Statistical Properties
The following metrics apply to uniform distributions:
- They have a lower limit (lowest possible value): min = [latex]a[/latex]
- They have an upper limit (highest possible value): max = [latex]b[/latex]
- The mean is: [latex]\mu = \frac{a+b}{2}[/latex]
- The standard deviation is: [latex]\sigma = \frac{b-a}{\sqrt{12}}[/latex]
- The variance is: [latex]\sigma^2 = \frac{(b-a)^2}{12}[/latex]
- The distribution is symmetric, so skewness = 0.
Video Explaining Uniform Distributions
Key Takeaways (EXERCISE)
Key Takeaways: Continuous Uniform Distributions
Your Own Notes (EXERCISE)
- Are there any notes you want to take from this section? Is there anything you'd like to copy and paste below?
- These notes are for you only (they will not be stored anywhere)
- Make sure to download them at the end to use as a reference
