16 What is p hacking?
p-hacking or data dredging
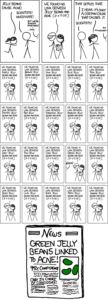
Comic: XKCD, https://xkcd.com/882/
What is p-hacking?
Recall the iced-coffee promotion. Normally, the average sales per customer in our store is $4.18. I recently ran a promotion where the store offered half-priced iced coffees. My hope is that this changes customer buying habits enough to raise the average sale per customer. We also really want to succeed! Our boss was unsure about the promotion, and if it turns out not to have an effect, we're
NULL HYPOTHESIS: The promotion didn't work, so sales are the same or decreased:
ALTERNATIVE HYPOTHESIS: The promotion worked, and average sales increased!:
Remember, we need to come up with a criteria to decide when to make a decision to implement iced-coffee afternoons across the entire chain. We use the typical 5% level of significance. That is, we will reject the null hypothesis, and conclude that there is enough evidence to show that the promotion raises the average customer bill, if p < 0.05.
In class we noted that if we use a significance level of 0.05, we would expect a result this strange if the null hypothesis was true only 5% of the time. But what if I... did the experiment 20 times? So, every day I pick out 50 random customers, and measure their average spend. Even if the promotion didn't do anything, we would expect that at least one of these samples would have a sample mean that was far away enough from the true population mean of $4.18 to give a small p-value.
Here's the result of my experiment (run on Excel using the norm.inv() command to pull from the correct distribution. I used a standard error of
, just like last week. If you open the file, you will rerun the randomizing, and should get different results.
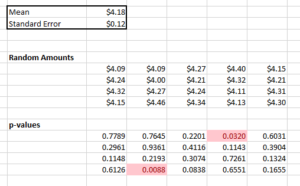
Then I show the best result to my boss - if this screengrab, I have an impressive result of p = 0.0088, which is less than 1%, a strong result! Note that in 7 of the 20 experiments, my sample mean was actually lower than $4.18.
Publication Bias
I hope that it's clear that only showing the good results to my boss would be unethical, and would not benefit our business. But in the world of research, it's often unusual to publish something that has a negative conclusion - "not enough evidence to suggest anything" is an unexciting headline. That means that this ends up happening more than we would like.
For more info, try googling "reproducibility crisis", to see how publishing only good results has gotten the field of psychology into hot water.
Data Dredging, or what about the green jellybeans?
This is a little bit different. In the comic at the top, the researcher didn't test jellybeans over and over. Instead, she kept on testing different hypotheses, from the same dataset. Much as testing the same false hypothesis 20 times gave us significant results, testing 20 different, but all false hypotheses might give us something that is statistically significant (ie, p < 0.05) by random chance. Certainly, if we test 100 or 1000 or even 10,000 hypotheses all at once, we would probably come up with something significant.
More to explore:
- Try to get a publishable result, by testing different factors: https://projects.fivethirtyeight.com/p-hacking/
- Check out some weird and spurious correlations, by comparing thousands of variables: http://www.tylervigen.com/spurious-correlations
- Read up on what happens to a promising career when people find out you've been p-hacking: https://www.buzzfeednews.com/article/stephaniemlee/brian-wansink-cornell-p-hacking
