15 Measures of Association
Some Statistics that you may need:
Correlation
A correlation exists between two variables when one of them is related to the other in some way.
A scatter plot is a graph in which the paired [latex](x,y)[/latex] sample data are plotted with a horizontal [latex]x[/latex]-axis and a vertical [latex]y[/latex]-axis.
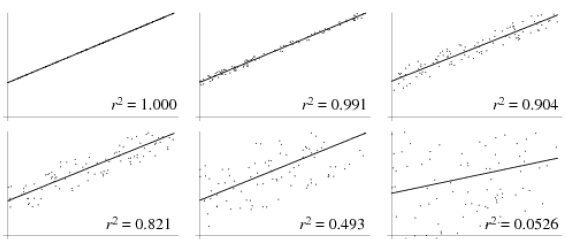
Linear Correlation means our plot looks like a line
IMAGE
The Linear Correlation Coefficient or Pearson Product Moment Correlation Coefficient is a way to look at the variances of our data and come up with [latex]r[/latex], a number which tells us how strong the correlation is.
\[r = \frac{1}{n-1}\Sigma \left( \frac{x-\bar{x}}{s_x}\right)\left( \frac{y-\bar{y}}{s_y}\right)\]
\[r = \frac{1}{n-1}\Sigma \left( \frac{x-\bar{x}}{s_x}\right)\left( \frac{y-\bar{y}}{s_y}\right)\]
where the sum ∑ is over all ordered pairs (x,y), sx is the standard deviation of the x values, sy is the standard deviation of the y values, and
and
are the sample means of x and y respectively.
|
Strong Positive |
Weak Positive |
Weak Negative |
Strong Negative |
|
[latex]r = 0.9[/latex] |
|
|
|
|
|
Covariance
Covariance is another way of measuring correlation, but can also look at some non-linear relationships. It is defined by:
\[cov(X, Y) = \frac{1}{n}\Sigma (x_i-\bar{x})(y_i-\bar{y})\]
where the sum ∑ is over all ordered pairs (x,y),
Fun fact! When you take the same set of data twice, you get the following identities:
\[cov(X, X)=\sigma^2\]
\[r=corr(X,X)=1\]
Correlation vs. Causation
In the following chart, we can see a clear correlation between the number of people who drowned by falling in a swimming pool in the USA and number of films that Nicholas Cage appeared in in that year.
CAUSATION: Do you think Nicholas Cage causes drowning?
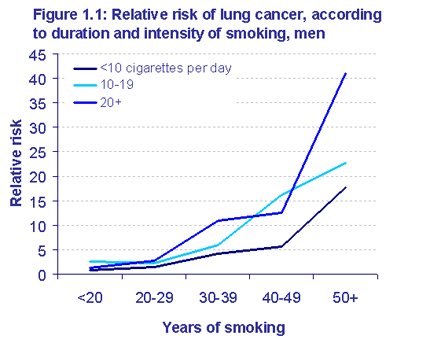
Or: Does smoking cause lung cancer? It’s harder than you think to prove.
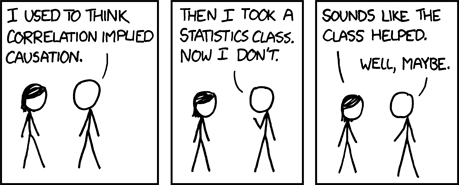
Remember….. CORRELATION does not imply CAUSATION
The term for a relationship between two variables
