14 Probabilities
Note: I'm posting this, but the formulae definitely need work!
Why are Probabilities Important?
But first, some VERY FAST recap of the theory of probabilities:
Probability Distributions
A Random Variable is variable (typically represented by X) that has a single numerical value (determined by chance) for each outcome of a procedure (or experiment).
- For example, X = the velocity of an unladen swallow
- X = number of tabs open on your browser as you read this book.
There are two types of random variable:
A Discrete Random Variable has either a finite number of values or a countable number of values, that is, it results from a counting process.
- For example, the number of BCIT grads among 50 newly hired employees
- The number of lemons in my fridge right now.
A Continuous Random Variable has infinitely many values, which can be associated with measurements on a continuous scale in such a way that there are no gaps or interruptions.
- ie, the height of a randomly selected BCIT student
- The time at which you close this window and stop reviewing probabilities
Example
The union of two sets is denoted by [latex]A\cup B[/latex] and this is the OR.
The intersection of two sets is denoted by [latex]A\cap B[/latex] and this is the AND.
Mutually Exclusive:
A and B are mutually exclusive if P(A and B) = 0.
For example, being a heart and a spade.
Compliments:
A and B are compliments if they are mutually exclusive and mutually exhaustive. That is:
[latex]P(A \, and \, B) = 0[/latex] and [latex]P(A \, or \, B) = 1[/latex]
Conditional Probability of an Event
Given A and B are events in an experiment and
\[P(B|A)=\frac{P(A \cap B)}{P(A)}\]
Rearranging the above formula gives:
\[P(A \cap B)=P(A) \times P(B|A)\]
Independence vs Dependence
We say two events are independent if the occurrence of one does not affect the other.
We say two events are dependent, if they are not independent, that is the occurrence of one affects the occurrence of the other.
Probability Tables and Contingency Tables (also called joint distribution tables)
Put one mutually exclusive event and its complement along the top.
Put the other mutually exclusive event and its complement along the left side.
Inside the table put the “AND” probabilities.
|
|
A |
A̅ |
Total |
|
B |
P(A and B) |
P(A̅ and B) |
P(B) |
|
B̅ |
P(A and B̅) |
P(A̅ and B̅) |
P(B̅) |
|
Total |
P(A) |
P(A̅) |
1 |
Exercises
Example
In your stats computer lab, you decide to conduct of study of the ages of 300 business students and whether or not they live with their parents. You obtain the following results:
|
|
|
Ages |
|
||
|
|
|
18 – 27 |
28 – 37 |
38 – 47 |
Total |
|
Live with |
Yes |
185 |
5 |
0 |
190 |
|
No |
95 |
11 |
4 |
110 |
|
|
|
Total |
280 |
16 |
4 |
300 |
- Give a non-trivial example of two mutually exclusive events in this study.
- If a student is at least 28 years old, what is the probability they do not live with their parents?
- What is the probability a student lives with their parents or is from 28 to 37 years old?
- What is the probability of a student neither living with their parents nor being from
28 to 37 years old? - Are ages and living with parents independent events?
What’s a Probability Distribution?
A Probability Distribution is a graph, table, or formula that gives the probability of each value of the random variable.
There are two requirements for a probability distribution:
where x assumes all possible values (∑ refers to the sum)
for every value of [latex]x[/latex]
Expected Value or Mean of a Probability Distribution
\[\mu=\Sigma x P(x)=E(x)\]
Examples
Example
A rock concert producer has scheduled an outdoor concert. If it is warm that day, she expects to make a $20,000 profit. If it is cool that day, she expects to make a $5,000 profit. If it is very cold, she expects to suffer a $12,000 loss. Based upon historical data, the weather office has estimated the chances of a warm day to be 0.60; the chances of a cool day to be 0.25.
Construct a probability distribution. P(x) = probability that x occurs
|
Weather |
X = Profit |
P(x) |
x× P(x) |
|
Warm |
|
|
|
|
Cool |
|
|
|
|
Very Cold |
|
|
|
|
|
|
1.00 |
|
- What is the producer’s expected profit (or loss)?
- What is the probability that she will make a profit?
Different Probability Distributions
The Discrete Uniform Distribution
Every outcome from a to b is equally likely.
\[P(X)=\frac{1}{b-a+1}\]
For all [latex]a≤X≤b[/latex].
Mean and Standard Deviation of a Discrete Uniform Distribution
The Binomial Distribution
- The experiment must have a fixed number of identical trials.
- Each trial must have all outcomes classified into two categories (a success or failure)
- The trials must be independent (the outcome of any individual trial doesn't influence the outcome of another trial).
- The probabilities must remain constant/same for each trial.
- The variable of interest must be the number of successes in n trials.
Terminology:
- [latex]n[/latex] = fixed number of trials
- [latex]x[/latex] = specific number of successes in n trials
- [latex]p[/latex]= probability of success in each one of the n trials
- [latex]1-p[/latex]= probability of failure in each one of the n trials[latex]p[\latex]
- [latex]P(x)[/latex]= probability of getting exactly x successes among n trials
Combinations
How many ways can you choose x things out of a list of n things?
\[_nC_x= \binom{n}{x} = \frac{n!}{x!(n-x)!}\]
Where
Binomial Probability Formula
\[P(x) = _nC_{x} p^{x} (1-p)^{n-x}\]
If [latex]n = 5, p = 0.2, x = 3[/latex]:
\[P(x=3) = _5C_{3} 0.2^{3} (0.8)^{2}=0.0512\]
Excel: =BINOM.DIST(3, 5, 0.2,0)
R: dbinom(x = 3, size = 5, prob = 0.2)
CUMULATIVE
\[P(X≤3)=P(x = 0)+P(x=1)+P(x=2)+P(x=3)=0.99328\]
Excel: =BINOM.DIST(3, 5, 0.2,1)
R: pbinom(q = 3, size = 5, prob = 0.2)
Mean and Standard Deviation of a Binomial Distribution
A quiz consists of 5 multiple-choice questions with 4 possible answers for each question. The student is unprepared for the exam and randomly selects answers.
|
# of successes |
# of failures |
Probability |
|
0 |
|
|
|
1 |
|
|
|
2 |
|
|
|
3 |
|
|
|
4 |
|
|
|
5 |
|
|
Find the probability that the student gets:
all five correct
none correct
exactly two correct
(d) at least one correct
The Poisson Distributions
the random variable x is the number of occurrences of an event over some time interval
the occurrences must be random
the occurrences must be independent of each other
the occurrences must be uniformly distributed over the interval being used
Examples where it applies:
The number of car accidents in the lower mainland per day.
The number of spam emails that a computer user will receive per week.
The number of phone calls to a call center per minute.
Notation
x = specific number occurrences in the time interval
=λ = the average number of occurrences in the time interval
Poisson Probability Formula
\[P(x)=μxe-μx!=λxe-λx!\]
If λ = 6, x = 3
PX=3=63e-63!=0.089235
Excel: =POISSON.DIST(3, 6, 0)
R: dpois(x = 3, lambda =6)
PX≤3=P0+P1+P2+P3=0.1512039
Excel: =POISSON.DIST(3, 6, 1)
R: ppois(q = 3, lambda =6)
Mean and Standard Deviation of a Poisson Distribution
An internet provider receives an average of 5 calls per half hour for technical support. The calls follow a Poisson distribution.
What is the probability there will be three calls in 30 minutes?
What is the probability there will be at least one call in 15 minutes?
What is the probability there will be at least 2 calls in half an hour?
The Continuous Uniform Distribution
Every outcome from a to b is equally likely.
Px1≤X≤x2=x2-x1b-a,
For all
.
Mean and Standard Deviation of a continuous uniform Distribution
The fill volume of a regular can of pop ranges uniformly from 354 mL to 358 mL. What is the mean fill volume?
b. What is the probability that the fill volume is between 354.3 mL and 355.2 mL?
The Normal Distribution
Used for continuous variables only. (e.g. Age, time, income, temperature, house prices).
Symmetrical about the mean (mean = median = mode) and bell-shaped.
Since there are many different normal curves, we convert all normal curves into one single curve called the standard normal (mean μ = 0, standard deviation σ = 1) by finding the z-score. (subtract the mean and divide by the standard deviation to calculate the z-score).
The area under the normal curve represents probability. The total area under the curve = 1.
Continuous random variables can take on any value within an interval since there are no gaps between the numbers. We no longer talk about the probability of the random variable assuming a particular value. Instead, we talk about the probability of the variable assuming a value within some given interval. The probability of the random variable assuming a particular value = 0.
Empirical Rule: Applies only to bell-shaped (normally distributed) populations
About 68% of the values will fall within one standard deviation of the mean.
About 95% of the values will fall within two standard deviations of the mean.
About 99.7% (almost 100% of values will fall within three standard deviations of the mean).
The selling prices of all stocks listed on the CDNX stock exchange are known to be normally distributed with a mean of $20 and a standard deviation of $4.
What percentage of stocks have a selling price between $20 and $40?
What is the minimum selling price of the most expensive 5% of stocks?
The prices of the middle 80% of stocks are between what two values?
The Exponential Distribution
How long between occurrences?
Measures the time between two things in a Poisson distribution: for example, what is the probability that there is at least a 15 minute gap between customers at your coffee shop?
Here, λ (the Greek letter lambda) is the average number of occurrences in a time interval.
Exponential Formula
PX≥a=1eλa
Mean and Standard Deviation of a continuous uniform Distribution
Telemarketers at ARG make an average of 3 calls per minute. Assuming that the calls follow a Poisson Distribution, what is the mean time between calls?
What is the probability that there will be at least a 30 second gap between incoming calls?
Try these at home. Which Distribution should you use?
A hotel’s records show that 70% of its guests are from the United States. In a random sample of 10 guests, what is the probability that exactly half are from the U.S.?
At the airport a plane takes off, on average, every 2 minutes. In any 10-minute interval, what is the probability that there are more than 2 departures?
What is the probability that there is at least a minute between successive departures?
Fun with Excel
0 or 1 is ALWAYS the last thing: do you want cumulative or not?
=BINOM.DIST(x, n, p, 0 or 1) and =BINOM.INV(n,p,P)
=POISSON.DIST(x, μ, 0 or 1)
Excel Commands for Normal Distribution:
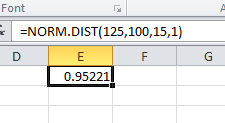
If we know µ, σ and X and are trying to find the probability that x<X: =norm.dist(x,µ,σ,1).
 Example SEQ Example_1 \* ARABIC 1
(The 1 is for cumulative, in Normal, we will use it in every command.)
Example 1: What is the probability that a person’s IQ is less than 125? (note: µ=100, σ=15)
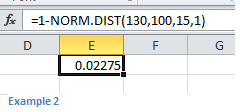 Example 2: What is the probability that an IQ is greater than 130?
To get the right side, just subtract your answer from 1: this gives the answer on the table.
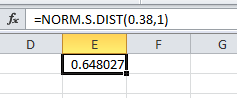
If you have z-scores, you may use the norm.s.dist command which cuts down on the typing:
 Example3
Example 3: What is the probability that z is less than .38?
Again, the 1 stands for cumulative. This is the same as typing =norm.dist(.38,1,0,1)
 Example 4
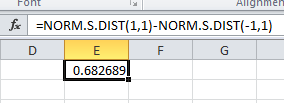
Example 4: What is the area (or probability) that Z is between -1 and 1?
You can subtract in 2 cells or in one… Notice that the larger z score goes first!
Inverses:
If you know that the area below X is P, and you are solving for X use =norm.inv(P,µ,σ):
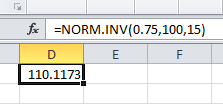 Example 5
Example 5: 75% of the population have an IQ below what score?
Make sure your area is in decimal! It needs to be greater than 0 and less than 1. Putting in 0 or 1 will give an error message.
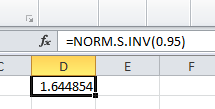 Example 6
Or you may recover z scores:
Example 6: Above what Z score do you find 5% of the population?
Since we are always working with areas to the left, we need to use .95, as 5% above is 95% below.
Fun with R
R is a great language for probabilities! Let’s do the same Normal problems, but in R:
Example 1: What is the probability that a person’s IQ is less than 125? (note: µ=100, σ=15)
Answer: `pnorm(q = 125, mean = 100, sd = 15)`
Example 2: What is the probability that an IQ is greater than 130?
Answer: pnorm(q = 130, mean = 100, sd = 15, lower.tail = FALSE)
Example 3: What is the probability that z is less than .38?
pnorm(q = 0.38, mean = 0, sd = 1)
or
pnorm(q = 0.38)
Example 4: What is the area (or probability) that Z is between -1 and 1?
pnorm(q = 1)-pnorm(q = -1)
Example 5: 75% of the population have an IQ below what score?
qnorm(p = 0.75, mean = 100, sd = 15)
Example 6: Above what Z score do you find 5% of the population?
- qnorm(p = 0.05, lower.tail = FALSE)
Distributions: NORM.DIST(1.96, 1, 0, 1) = 0.975 means that NORM.INV(0.975, 1, 0) = 1.96
|
Binomial Distribution |
Cnxpxqn-x |
=BINOM.DIST(X, n, p,0) |
Finds P(x) |
|
|
P(x≤a) |
=BINOM.DIST(a, n, p,1) |
Cumulative probability, includes all values smaller! |
|
|
P(a≤x≤b) |
=BINOM.DIST.RANGE(n, p, a, b) |
The probability it’s between 2 numbers |
|
|
P(x≤?)=P |
=BINOM.INV(n, p, P) |
Inverse or reverse cumulative probability. |
|
Poisson Distribution |
λxe-μx! |
=POISSON.DIST(x, λ, 0) |
Exactly x |
|
|
P(x≤a) |
=POISSON.DIST(a, λ, 1) |
a or smaller |
|
|
P(x≥a) |
=1 - POISSON.DIST(a-1, λ, 1) |
a or bigger |
|
|
P(a≤x≤b) |
= POISSON.DIST(b, λ, 1) - POISSON.DIST(a-1, λ, 1) |
|
|
Normal Distribution |
P(x≤a) |
=NORM.DIST(a, μ, σ, 1) |
Always use cumulative! |
|
|
P(x≥a) |
=1 - NORM.DIST(a, μ, σ, 1) |
|
|
|
P(a≤x≤b) |
= NORM.DIST(b, μ, σ, 1) - NORM.DIST(a, μ, σ, , 1) |
Subtract 2 things! |
|
|
P(x≤?)=P |
=NORM.INV(P, μ, σ) |
Reverse lookup! |
|
Exponential Distribution |
Px≤a=1-e-λa |
=EXPON.DIST(x, λ, 1) |
Excel always counts x and below |
|
|
Px≥a=e-λa |
=1 - EXPON.DIST(x, λ, 1) |
Use (1 –) to get x and above |
|
|
P(a≤x≤b) |
= EXPON.DIST(b, λ, 1) - EXPON.DIST(a, λ, 1) |
Subtract 2 things |
Randomizing
|
Name |
Command |
Notes & Examples |
|
Uniform Discrete |
=RANDBETWEEN(a,b) |
Gives a number between 1 and 10 inclusive =RANDBETWEEN(1,10) |
|
Binomial |
=BINOM.INV(n,p,RAND()) |
There are n = 20 people, the liklihood of one showing up is p = 0.30 # show up =BINOM.INV(20,0.3,RAND()) |
|
Bernoulli Trial |
=IF(RAND()<p,ans1,ans_2) |
Choose between two things, a 20% chance of being “happy”, an 80% chance of being “sad” =IF(RAND()<.2,”happy”,”sad”) |
|
General Discrete |
=LOOKUP(RAND(),lower_limits, answers) |
Pull a value from a table with given probabilities |
|
Uniform |
=RAND() |
Give a random number between 0 and 1 |
|
Uniform Continuous |
=a+(b-a)*RAND() |
Give a number between 10 and 11 =11+(12 - 11)*RAND()
|
|
Normal |
=NORM.INV(RAND(),μ ,σ) |
Pull a random IQ score if the mean is 100 and standard deviation 15 =NORM.INV(RAND(),100 ,15) |
|
Exponential |
=-(1/λ )*LN(RAND()) |
5 customers an hour come into my coffee shop. Pick a random time between two customers =-(1/5)*LN(RAND()) |
A Random Variable is variable (typically represented by X) that has a single numerical value (determined by chance) for each outcome of a procedure (or experiment).
has either a finite number of values or a countable number of values, that is, it results from a counting process.
has infinitely many values, which can be associated with measurements on a continuous scale in such a way that there are no gaps or interruptions.
A and B are mutually exclusive if P(A and B) = 0.
A and B are compliments if they are mutually exclusive and mutually exhaustive.
