2 Ricardian Trade
francis
Introduction
In this chapter, we explain the theory of Ricardian trade and why countries, regions and individuals are better off trading with each other rather than setting up barriers to trade. Finally, we introduce the concept of Willingness To Pay and Willingness To Accept which will be central in introducing the demand and supply curve in Chapter 3.
Example 2.1
First, gains from trade are introduced with a discussion question. You should be able to answer these questions using concepts seen in the previous Chapter. The question asks you to think outside the box. Use logic!
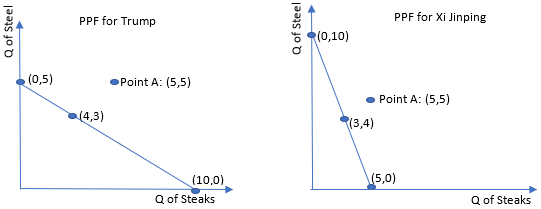
The following graphs show the PPF for Trump and Xi Jinping when they work 40 hours a week.
The previous question shows how people can be better off if they collaborate and trade together than if they live a life of autarky, without trading with anyone else. Trade is efficient because it allows individuals or societies to specialize in the production of goods and services for which they are more productive. This may be because they have better knowledge, human capital, technology or natural resources. Adam Smith (1776) is the first to be credited with developing a theory to explain why countries should trade together: the theory of absolute advantages. David Ricardo (1817) later developed the theory of comparative advantage.
The Theory of Absolute Advantages
The theory of absolute advantages states that countries should specialize in the production of goods for which they have an absolute advantage. A country has an absolute advantage in the production of a good if it's absolute cost of producing the good is lower than the absolute cost for other countries. One disadvantage of the theory of absolute advantages is that countries with only absolute advantages do not benefit from trade. Even if this is the case, countries may still benefit from trade. This is a problem with this theory. For this reason, economists kept looking for a better, more complete, theory of trade. David Ricardo found the solution with his theory of comparative advantages.
Example 2.2
In our example, Xi Jinping could produce 10 tons of steel in 40 hours. His absolute cost of producing one ton of steel is thus 4 hours of work ([latex]\frac{2}{3}[/latex] ) and 8 hours of work for a ton of steak. In the case of Trump, the cost is 8 hours of work per ton of steel and 4 hours per ton of steaks. We can show this information in a table:
| Cost of Production | Canada | China |
|---|---|---|
| 1 ton of steel | 8 hours | 6 hours |
| 1 ton of lumber | 3 hours | 5 hours |
Because the cost of producing steel is cheaper for Xi Jinping than for Trump, he should specialize in the production of steel while Trump should specialize in the production of steaks.
Example 2.3
Suppose that the following table shows the cost (in USD) of producing lumber and steel in the USA and in Azerbaijan.| Cost of production | USA | Azerbaijan |
|---|---|---|
| 1 ton of steel | $500 per ton | $675 per ton |
| 1 ton of lumber | $150 per ton | $225 per ton |
The theory of comparative advantages states that countries should specialize in the production of goods for which they have a lower relative opportunity cost of production. If you remember Chapter 1, you will remember that the opportunity cost of producing one good is the opposite of the opportunity cost of producing the other good (see example 1.5). As such, if a country has a lower opportunity cost for producing a good, it will automatically have a higher opportunity cost in the production of the other good. Unless 2 countries have the same opportunity cost, they will always gain from trade: countries (and people) should trade together!
Example 2.4
Take the previous example with the USA and Azerbaijan:
| Cost of production | USA | Azerbaijan |
|---|---|---|
| 1 ton of steel | $500 per ton | $675 per ton |
| 1 ton of lumber | $150 per ton | $225 per ton |
We can calculate the opportunity cost for each country (as per the note on math in previous chapters). The opportunity cost of a ton of steel is [latex][/latex]\frac{Price of steel}{Price of lumber}. The following table shows the absolute cost and the opportunity cost for the previous example:
| Opportunity Cost | USA | Azerbaijan |
|---|---|---|
| Steel | [latex]\frac{500}{150}=3.33[/latex] tons of lumber | [latex]\frac{675}{225}=3[/latex] tons of lumber |
| Lumber | [latex]\frac{150}{500}=0.3[/latex] tons of steel | [latex]\frac{225}{675}=0.3333[/latex] tons of steel |
Willingness to Accept
Example 2.5
Let’s use the example with the USA and Azerbaijan. The opportunity cost table is copied here for your convenience:| Opportunity Cost | USA | Azerbaijan |
|---|---|---|
| Steel | [latex]\frac{500}{150}=3.33[/latex] tons of lumber | [latex]\frac{675}{225}=3[/latex] tons of lumber |
| Lumber | [latex]\frac{150}{500}=0.3[/latex] tons of steel | [latex]\frac{225}{675}=0.3333[/latex] tons of steel |