Alan Jenks
Introduction
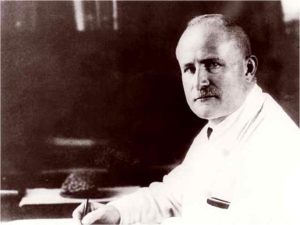
In 1929 a German Psychiatrist named Hans Berger discovered that the electrical activity of the brain could be visualized and recorded on a device he invented called the Electroencephalogram (EEG) (Berger, 1929). During Berger’s initial recordings with EEG, electrode needles were inserted into the periosteum of the cranial bones and the resultant EEG was plotted on a piece of paper. Since this time EEG recordings have become less invasive, more reliable, and quite common in laboratories and the medical field worldwide.
Two key discoveries led up to the construction of the first electroencephalogram. The first being electrical impulses actually being observed for the first time in July 1875 by Richard Caton through the galvanometer, which is a type of electrical ammeter to measure electric current. The second was Ernst von Fleischl-Marxow and his studies on evoked potentials, linking nervous system activity to muscle movements. Hans Berger used these two discoveries as the foundation of what he would soon discover, the electroencephalogram. Using silver foil electrodes, capillary electrometer and galvanometer, Berger was able to capture what was the first recorded Alpha (bottom picture) and Beta (top picture) brain waves.
The living brain produces continuous outputs of electrical signals. Whether we are awake or asleep, the brain is always working. We commonly call these signals ‘brain waves’ and they can be visualized on an EEG. The EEG ‘reads’ summations of the excitatory and inhibitory post synaptic potentials (EPSPs and IPSPs respectively), but even though the signals are summated, they are still extremely small. So small, in fact that we measure them in microvolts! The signals are then amplified many times and displayed as waves of varying frequency and amplitude.
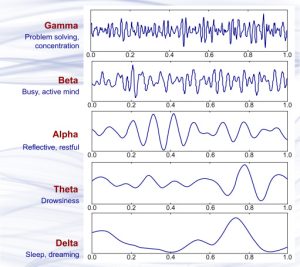
There are four basic EEG frequency patterns: Beta (14-30 Hz), Alpha (8-13 Hz), Theta (4-7 Hz) and Delta (1-3 Hz). Beta and Alpha waves occur when we are awake (and thus will be examined in this lab), while Theta and Delta waves are associated with light and deep sleep. For a quick reference please see Table 1.
Table 1: EEG patterns and Behaviour States
| EEG Pattern | Behaviour State |
| Alpha | Awake, non-focused, relaxed, drowsy, low environmental stimulation, eyes closed |
| Beta | Awake, alert, focused attention, problem solving, high level of environmental stimulation, eyes open |
| Theta | Visual imagery, hypnagogic imagery, light sleep |
| Delta | Deep, restful sleep, vague dream status |
The frequency of the waves is defined as the number of wave cycles that occur in a set time period. One EEG wave cycle occurring in a second of time is called a Hertz (Hz). The amplitude of the waves can be thought of as the ‘strength’ of the electrical signal. Both the frequency and amplitude of the waves can give us information about cortical arousal. Cortical arousal refers to the firing pattern of neurons in the cerebral cortex. If the level of cortical arousal decreases, the frequency of the EEG wave will decrease, but the amplitude will increase. This is a signal to us that there are more neurons firing in a specific area/region of the cortex (ie-the task has likely become more specialized and a specific group of neurons is required to achieve it, as opposed to a bunch of random neurons firing randomly, or multiple non-specific sites firing for a multitude of random tasks). If the EEG wave is showing low amplitude but high frequency, we assume different groups of cells are involved in different activities.
Because brain waves happen at different frequencies, we can set our filtres on the computer to isolate the ones we want! For example, if we wanted to look at the brain activity while someone is attempting a task that requires a lot of focus, we would want to filtre for Beta waves!
Relative to other neuroimaging tools like MRI, EEG is relatively inexpensive and useful for examining the brain in a non-invasive way. In the research and medical field, it is often used to check for abnormalities or neurodegeneration, but also to examine brain functioning in various psychological states, like when someone is sleep deprived, stressed, or anxious, depressed or suffering from various stages of psychosis.
In this way we can tell how things, like day-to-day life, change our brain chemistry and look for ways to remedy or restore the intricate functioning of a healthy brain!
Media Attributions
- 381_2020_4564_Fig1_HTML
- 3-s2.0-B9780128044902000026-f02-01-9780128044902
