14.7 Acid-Base Titrations
Learning Objectives
By the end of this section, you will be able to:
- Interpret titration curves for strong acid/strong base systems
- Compute sample pH at important stages of a titration
As seen in the chapter on the stoichiometry of chemical reactions, titrations can be used to quantitatively analyze solutions for their acid or base concentrations. In this section, we will explore the underlying chemical equilibria that make acid-base titrimetry a useful analytical technique.
Titration Curves
A titration curve is a plot of some solution property versus the amount of added titrant. For acid-base titrations, solution pH is a useful property to monitor because it varies predictably with the solution composition and, therefore, may be used to monitor the titration’s progress and detect its end point. The following example demonstrates the computation of pH for titration of a strong acid after additions of several specified volumes of strong base.
Calculating pH for Titration Solutions: Strong Acid/Strong Base
A titration is carried out for 25.00 mL of 0.100 M HCl (strong acid) with 0.100 M of a strong base NaOH. Calculate the pH at these volumes of added base solution:
(a) 0.00 mL
(b) 12.50 mL
(c) 25.00 mL
(d) 37.50 mL
Solution:
(a) Titrant volume = 0.00 mL. The solution pH is due to the acid ionization of HCl. Because this is a strong acid, the ionization is complete and the hydronium ion molarity is 0.100 M. The pH of the solution is then
(b) Titrant volume = 12.50 mL.
H3O+(aq) + OH–(aq) → 2H2O(aq)
Since the acid sample and the base titrant are both monoprotic and equally concentrated, this titrant addition involves less than a stoichiometric amount of base, and so it is completely consumed by reaction with the excess acid in the sample. The concentration of acid remaining is computed by subtracting the consumed amount from the intial amount and then dividing by the solution volume:
(0.02500 L)(0.100 mol/L) = 0.00250 mol H3O+ initially
reacts with (0.01250 L)(0.100 mol/L) = 0.00125 mol OH- in a 1:1 ratio
leaving 0.00250 mol – 0.00125 mol = 0.00125 mol H3O+
(c) Titrant volume = 25.00 mL.
H3O+(aq) + OH–(aq) → 2H2O(aq)
This titrant addition involves a stoichiometric amount of base (the equivalence point), and so only products of the neutralization reaction are in solution (water and NaCl). Neither the cation nor the anion of this salt undergo acid-base ionization; the only process generating hydronium ions is the autohydrolysis of water. The solution is neutral, having a pH = 7.00.
(d) Titrant volume = 37.50 mL.
H3O+(aq) + OH–(aq) → 2H2O(aq)
This involves the addition of titrant in excess of the equivalence point. The solution pH is then calculated using the concentration of hydroxide ion:
0.00250 mol H3O+ initially, as calculated in part (b)
(0.03750 L)(0.100 mol/L) = 0.00375 mol OH– total added
reacts with H3O+ in a 1:1 ratio
leaving 0.00375 mol – 0.00250 mol = 0.00125 mol OH–
[OH-] = (0.00125 mol)/(0.06250 L) = 0.0200 M
pH = 14.00 − pOH = 14.00 + log[OH−] = 14.00 + log(0.0200 M) = 12.30
Check Your Learning:
Calculate the pH for the strong acid/strong base titration between 50.0 mL of 0.100 M HNO3(aq) and 0.200 M NaOH (titrant) at the listed volumes of added base: 0.00 mL, 15.0 mL, 25.0 mL, and 40.0 mL.
0.00 mL: 1.000; 15.0 mL: 1.51; 25.0 mL: 7.00; 40.0 mL: 12.52
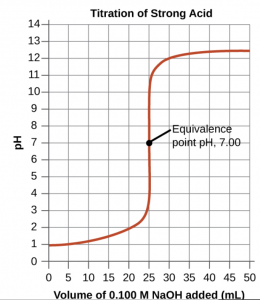
Performing additional calculations similar to those in the preceding example permits a more full assessment of titration curves. A summary of pH/volume data pairs for the strong acid titrations is provided in (Figure) and plotted as a titration curve. A consideration of the titration curve illustrates several important concepts that are best addressed by identifying the four stages of a titration:
initial state (added titrant volume = 0 mL): pH is determined by the acid being titrated
pre-equivalence point (0 mL < V < 25 mL): solution pH increases gradually and the acid is consumed by reaction with added titrant
equivalence point (V = 25 mL): a drastic rise in pH is observed as the solution composition transitions from acidic to neutral
post-equivalence point (V > 25 mL): pH is determined by the amount of excess strong base titrant added
| pH Values in the Titrations of a Strong Acid | |||
|---|---|---|---|
| Volume of 0.100 M NaOH Added (mL) | Moles of NaOH Added | pH Values 0.100 M HCl1 | |
| 0.0 | 0.0 | 1.00 | |
| 5.0 | 0.00050 | 1.18 | |
| 10.0 | 0.00100 | 1.37 | |
| 15.0 | 0.00150 | 1.60 | |
| 20.0 | 0.00200 | 1.95 | |
| 22.0 | 0.00220 | 2.20 | |
| 24.0 | 0.00240 | 2.69 | |
| 24.5 | 0.00245 | 3.00 | |
| 24.9 | 0.00249 | 3.70 | |
| 25.0 | 0.00250 | 7.00 | |
| 25.1 | 0.00251 | 10.30 | |
| 25.5 | 0.00255 | 11.00 | |
| 26.0 | 0.00260 | 11.29 | |
| 28.0 | 0.00280 | 11.75 | |
| 30.0 | 0.00300 | 11.96 | |
| 35.0 | 0.00350 | 12.22 | |
| 40.0 | 0.00400 | 12.36 | |
| 45.0 | 0.00450 | 12.46 | |
| 50.0 | 0.00500 | 12.52 | |
Key Concepts and Summary
The titration curve for an acid-base titration is typically a plot of pH versus volume of added titrant.
Footnotes
- 1Titration of 25.00 mL of 0.100 M HCl (0.00250 mol of HCI) with 0.100 M NaOH.
Glossary
- titration curve
- plot of some sample property (such as pH) versus volume of added titrant