Main Body
Chapter 9
Topic 9 — Rogue Atmosphere: Severe Weather
“Climate is what you expect….weather is what you get.”
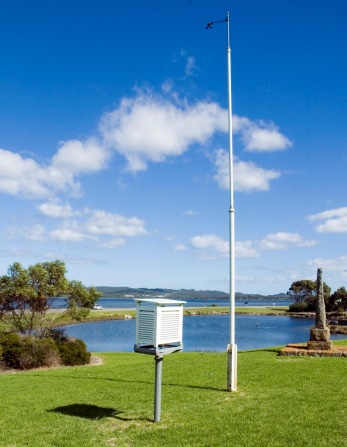
Short term measurements of temperature, precipitation, humidity, pressure, cloud cover, windspeed and direction are all measures of weather. The difference between weather and climate is simply a matter of time. Weather conditions are measured over minutes to hours to days to weeks, whereas climate conditions are averaged over decades (usually at least 30 years). Climate averages the weather conditions for a specific location over a long period of time building a picture of the general range of conditions expected for a given place. On any given day, the actual conditions are variable, but should be found within this range. The most common climate variables recorded for a given location are temperature and precipitation. The spatial distribution of these two variables have been used in global climate classifications and analyzing relationships between climate and the biosphere.
We frequently hear about how scientists are observing changing climate patterns. This means the long term average conditions of temperature and precipitation for specific locations are changing. The reason scientists are confident that changes are occurring is because we have a long record of climate normals. Climate normals refer to the range of normal temperature readings for a given location over a long period of time (usually at least 30 years, but often longer). Using such a long time-frame allows extreme measurements to be balanced out in the record, and gives a good sense of the overall variability for a specific location. Comparing current conditions against climate normals allows scientists to determine if current conditions are within the expected range of what is normal, or outside of that range.
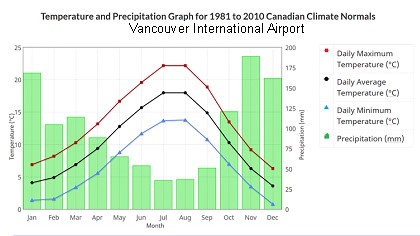
Figure: Long-term climate normal for Vancouver International Airport. This is a typical graphic for representing climate called a climograph, where the two y-axes represent temperature (line graph) and precipitation (bar graph), and the x-axis covers a time range (usually a year). How do the expected climate values compare to the current weather conditions for this month?
For this reason, there is a significant difference between ‘extreme’ weather and ‘severe’ weather at a specific location. Severe weather refers to weather that creates hazardous conditions for the humans inhabiting the environment in which it occurs. Extreme weather refers to very rarely occurring weather events for a specific region. For some places, severe weather may also be very rare and extreme, but for other places, severe weather may be normal. For example, the state of Florida commonly experiences powerful storms known as hurricanes. These storms can release hundreds of millimetres of rainfall in a matter of hours and produce windspeeds in excess of 200 km/hr. Although this weather is ‘severe’ in its impact on the Florida region, it is not necessarily ‘extreme’ because it is part of the normal climate pattern. If, however, there was a shift in conditions and average precipitation and windspeed started to change, we might say we were experiencing ‘extreme’ weather patterns, because the observed conditions were at the far edge of what is considered normal under the expected climate.
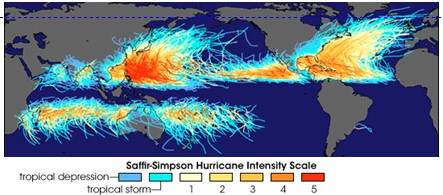
Hurricanes are incredibly powerful low pressure systems that develop from rapidly rising unstable air. Their intense power comes from energy released as water changes state from gas to liquid (condensation). This phase change releases significant amount of energy to the surrounding environment and is made possible when water evaporates from a warm ocean surface and is rapidly transported upwards through the atmosphere to much cooler temperatures where it condenses to form clouds and precipitation. Hurricane formation is therefore restricted to areas where warm surface water (≥26° C) is plentiful, between the Tropics of Cancer and Capricorn. The strong rotational element of these storms is provided by the Coriolis effect. Low pressure systems rotate counter-clockwise in the northern hemisphere. Near the equator where water temperature is high enough, but the Coriolis effect is too weak hurricanes will not form. Therefore hurricanes generally form in a band between 8° and 20° latitude.
Given the effects of climate change (general increases in air and ocean temperatures) one might think it would be possible to predict a change in hurricane formation and activity based on the conditions under which hurricanes form. The reality is that the systems which underpin hurricane formation are much more complex. It has also been challenging to construct a reliable record of hurricane activity that spans longer than 30 years, given that satellite observations of hurricane activity only began in the late 1970’s. As a result it has been difficult to confirm a trend in changing hurricane conditions, and the topic has sparked considerable scientific debate. Here is the statement on hurricane activity from the most recent Intergovernmental Panel on Climate Change (IPCC) report (AR5): *note – they refer to hurricanes as “tropical cyclones”
“Projections for the 21st century indicate that it is likely that the global frequency of tropical cyclones will either decrease or remain essentially unchanged, concurrent with a likely increase in both global mean tropical cyclone maximum wind speed and rain rates.”
Often when thinking of issues related to severe weather we focus on the human impacts, while not paying attention to the larger system . Large storms like hurricanes crossing ocean basins have been found to be significant in transporting dust and sediment between continents. For example, dust from the African Sahara, rich in phosphorous appears to play a critical role in biological productivity in the South American Amazon river basin. Weakening future storms have the potential to reduce this mechanism of nutrient transport, impacting the biosphere.
Climate Normals are three-decade averages of climatological variables including temperature and precipitation (NOAA)
Climate Normals and Averages are used to summarize or describe the average climatic conditions of a particular location (Gov’t of Canada)
the arithmetic average of a climate element such as temperature over a prescribed 30-year interval (Wisconsin State Climatology Office)