3.5 Working with macroeconomics data: PPP GDP per capita of countries around the world
Sustained growth in GDP continues to be a primary predictor for improvements in quality of living. Small differences in growth rates over times can lead to significantly different outcomes. This lab explores these questions:
- How are these differences measured?
- How are the outcomes compared?
Learning outcomes
- Understand the definition of PPP GDP per capita.
- Calculate growth rates and compound growth rate and discuss your results.
- Improve your calculating and graphing skills in Excel.
Step 1: Download the data
Download data about the real GDP per capital of two countries from 2000 to the most recent year available.
- Go to the World Development Indicators.
- In the Variables tab, make the following selections:
- Database: Check World Development Indicators (this is the default value)
- Country: Click the X to unselect all. Then select Canada and a country starting with the first letter of your first name. (If there is no data for this period for a country that starts with the first letter of your name, choose a country starting with the next letter in the alphabet.)
- Series: Click the X to unselect all. Then select GDP per capita, PPP (Constant 2017 International $).
- Time: Click the X to unselect all. Then select 2000 and the most recent year (e.g., 2023).
- In the Layout tab, make the following selections:
- Orientation
- For Time, select Row.
- For Series, select Row.
- For Country, select Column.
- In the pop-up window, click Apply changes.
- Click Download options and choose Excel.
- In the Preview section, click GDP per capita, PPP, Constant 2017 International $ and read the definition of GDP per capita, PPP (constant 2017 International $).
- Read the first paragraph of Purchasing Power Parity for a definition.
Step 2: Calculate the annual growth rates and generate the graph
- In your Excel workbook, calculate the year-to-year real GDP per capita growth rate for both countries using formulas.
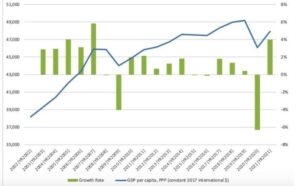
- Generate a graph showing the GDP per capita and its growth rates over time for the country of your choice. The graph in Figure 3.1 is an example.
- The graph should have years on the x-axis, and it should have two y-axes.
- The left y-axis should show real GDP/capita. Consider changing the starting value of your y-axis to show your data clearly.
- The right y-axis should show growth rate. Make sure it is clear what each axis represents.
- Use two different chart types for the real GDP per capita and its growth rate.
- Analyze your graph. What can you say about the trend of the economic growth of the two countries?
Figure 3.1
Canadian Real GDP per Capita and its Growth Rate
Step 3: Calculate compound growth
- Calculate the average annual compound growth rate from 2000–2022 for Canada. Hint: A country grew x% every year to go from the GDP per capita for 2000 to that of 2022. There are 22 periods from 2000–2022.
- Repeat the process to calculate the average annual compound growth rate from 2000–2019 and from 2020–2022. Apply the rule of 70.
