Chapter 2- Analyzing the biological features and functions for a site
Laurie Stott
Introduction
While this chapter will focus on the biological aspects of a site assessment, it is important to note that the biological elements are intrinsically linked with the geological and physical aspects of a site and are rarely considered or assessed independently. The more common approach is a biophysical inventory with a review and identification of the geological or larger landscape context of area where a specific site is located. For this chapter and the purpose of providing an overview of what such an assessment involves, the terms used interchangeably to describe an assessment of the natural elements or biology of a site are environmental or biophysical survey.
A central tenet for any biophysical assessment is that ‘it’s all connected’. ‘Nature’ and all the associated functions and elements that comprise the ecology of an area must be viewed within the context where they are found. Any one element, while unique with specific characteristics and habitat requirements, is connected to and interacts with a many other elements and aspects of a site. And, these relationships and connections do not begin and end at the boundary of the area of interest for a given site. They extend well beyond the edge of a given property and incorporate a complex and interlinked system of living and non-living elements and forces.
An understanding, even on a basic level, of the connectivity and relationships between elements in an ecosystem is important because impacts from development, alterations to vegetation, to physical features like soils, slope or water courses, will affect, and not often in a positive way, the plant and animal species that live there. It would take a great deal of time and resources to complete a full inventory and assessment of every species of plant or animal and their respective needs or function within a given area or ecosystem. Time and resources that are just not available for individual site assessments and because of this, biological assessments tend to be specific and constrained to the regulatory requirements for local, provincial and federal government agencies.
The affordability and availability of aerial imagery and remote sensing technologies such as LANDSAT, aerial imagery and orthophotos, multi-spectral and thermal imagery, LiDAR, and powerful geospatial analysis tools like ESRI’s ArcGIS Spatial Analyst are all significant aids in the assessment and understanding of the biological and physical aspects of a site. Remotely piloted aerial systems (RPAS), more commonly known as drones, allow surveyors and biologists a perspective and access to areas that was not previously feasible or available.
Even with the access and use of these novel tools and technologies, it is not possible to capture or assess all of the biological elements and functions that exist on a site. Time and resource limitations require environmental professionals to focus their assessment on key biological elements, often focusing on those defined by legal or regulatory requirements or liabilities. The point here is that a biological or biophysical assessment is a snapshot of a site over a specific time frame that tells part of the story for specific aspects of the site as defined by the variables (and biases) included in the study design.
One aspect of site assessments that is of increasing importance, given the need to address and create resilience in our communities to the effects of climate change, is identification and calculation of existing and potential ecosystem services. For example, the inherent qualities of trees offer services that directly benefit us and mitigate impacts of our activities. Trees store and sequester carbon storage, they remove pollutants from the air, reduce storm water run-off, and contribute to a stable hydrological cycle. Trees contribute to cooler air and water temperatures. Beyond the ecological services, trees, depending on their relative position to a building, they can reduce energy required to heat or cool a building. Trees and forests have been linked to benefits for mental and physical health, reduced crime rates and increased property values.
A site assessment for the construction of a building or larger complex would look at the footprint of building(s) and associated infrastructure and the direct and in-direct impacts of construction and alteration to site (and this includes on-site and off-site impacts). Impacts include, but are not limited to, a loss of plants (flora), habitat and access for animals (fauna), ecological functions and services on site and, subsequently, loss within the larger, adjacent and interconnected natural systems (often referred to as the ecosystem). While not always considered, change on a site will inevitably impact adjacent systems and diminish connectivity and larger ecosystem functions with larger region.
This chapter is not intended to provide a lesson in ecology or function as a biology primer. Nor is it intended as a manual or guide for conducting an environmental assessment of a site. Rather, it is an overview of the common elements and frameworks considered in a biophysical inventory. The second part of the chapter will present a few of the tools and methods used for assessment and analysis – both conventional and novel. The final section of this chapter reviews a number of resources that support a desktop analysis of an area
A biophysical inventory and site assessment: conventional methods and approach
A review of a site location with the landscape and region is often the first task for an environmental assessment. Such a review includes a review local weather patterns and norms, vegetation communities, bedrock and soils, the topography (hills and valleys or form and feature of landscape) and the water features and hydrology across larger region within which the site is located. The location within the larger landscape is also important and can affect weather patterns, amount of solar radiation, precipitation and drainage.
The best way to explain geography and a site is a map. The illustration below provides an example of a specific site, the Cheakamus Centre, located in the Pacific Northwest along the Sea to Sky Highway north of the community of Squamish in British Columbia, Canada. This site provides a good case study for an environmental assessment. This property has been used in previous research projects by students from several programs at BCIT, including the Architectural Science department, and we have a great deal of information and detail to review and share here. To review projects completed to date, please visit the ESRI Story Map for the site “Cheakamus Centre: Opportunities for Education and Research”.
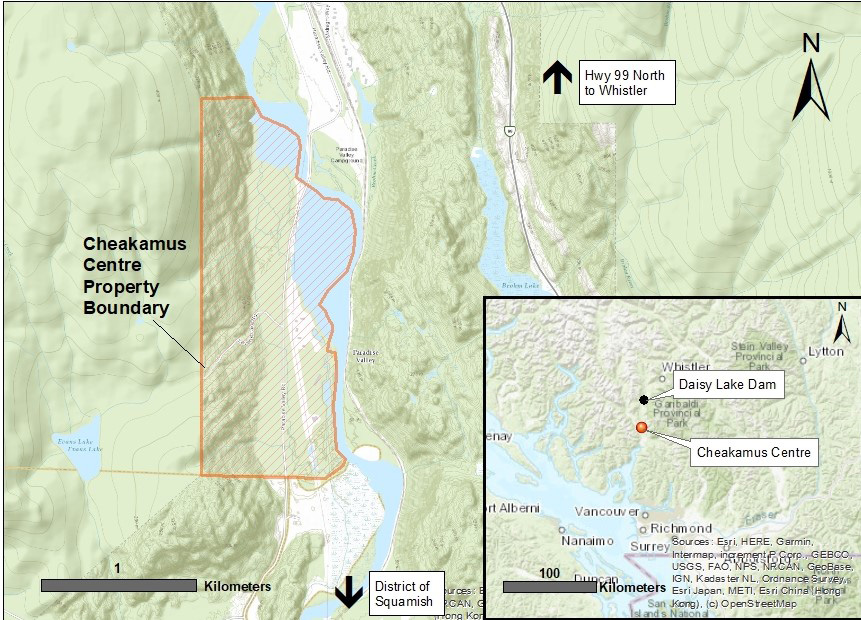
Figure 1: Site Map for Cheakamus Centre property and local topography. Site located north of the District of Squamish, BC. Note the reference to location of Daisy Lake Dam relative to Cheakamus Centre location.
The site map and location with in region provided in map, inset in Figure 1 illustrates the boundary of the site, and the inset provides the location within the local region. A site location map establishes ‘place’ for a site and highlights the geographical context and relative position of area to other landmarks or significant features. There are many ways to represent the geographical context and elements of site. Data and information used to describe a site can vary by location and by the purpose and objectives of a site assessment. As you see in the series of maps provided in Figure 2, there are many ways to represent the features or context of a site – the maps provided here are but an example of the data that could be used to describe a site.
Today, we have many layers of data available for sites. Most areas where any development or construction will take place, there is likely more data than you could use or need for your description of a site and an environmental professional must be able to parse and filter data to find and use information relevant to a study or site review. Even then, the datasets and important elements can rarely all be used in a single map. A map series that separates specific types or categories of data can be useful for reference and for analysis. The maps included in Figure 2 are an example of a map series and illustrate the following aspects of the site: (1) biogeoclimatic zones; (2) bedrock geology class or type; (3); the topography based on a digital elevation model raster; (4) District of Squamish land use zoning; (5) road, rail and hydro line infrastructure; (6) watershed boundary for the Cheakamus River; (7) Squamish First Nation traditional territory; (8) hydrology or rivers, streams and lakes in area; and (9) critical habitat for the federally listed species Marbled Murrelet.
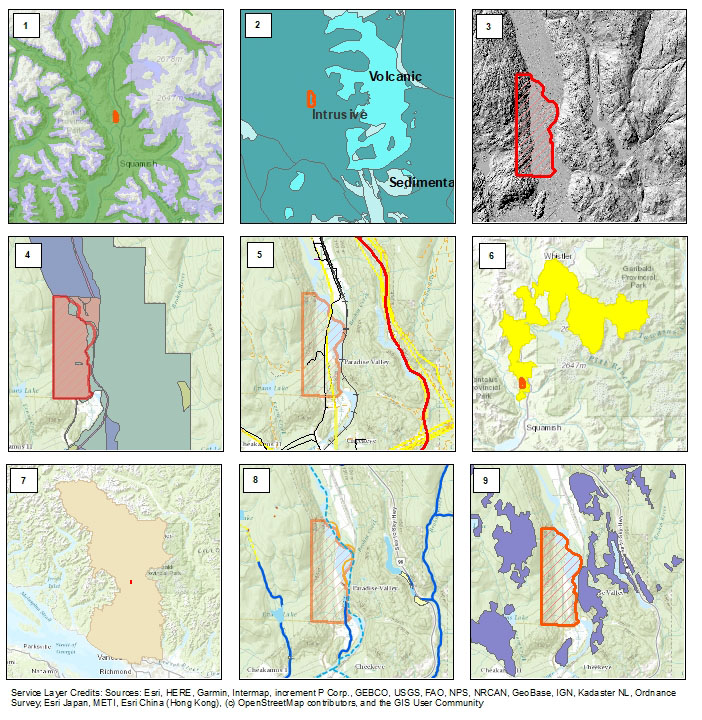
The map series example provided here gives the boundary for the Squamish First Nation traditional lands only. Note that maps for a site assessment would normally include an outline or identification of all jurisdiction boundaries, local, regional and First Nation traditional lands. This is important to include in any site assessment as the legislation and legal duties, requirements for access, activities permitted, and the information and monitoring for a baseline study, impact mitigation, remediation and monitoring will vary across jurisdictions and government agencies. All must be considered, consulted and accommodated in the design of a biophysical site assessment study.
Note that much of the data used in the preliminary assessment of the site was accessed via the BC Data Catalogue. The province has created an extensive catalog of digital data and layers for use with geographic information systems like ArcGIS Maps, ArcGIS Pro and Google Earth. The layers are also accessible via the provincial data viewer iMapBC. Information on how to use and access these tools is available via both the BC Data Catalogue and the BC Map Services page.
At a site level, vegetation communities, vegetation structure, age and size, diversity of plant types (species) are all important and directly related to the biogeoclimatic zones defined in the British Columbia Biogeoclimatic Ecosystem Classification or BEC system that exists for the entire province. Biogeoclimatic (BGCZ) or BEC zones are unique to BC and were developed by researchers at UBC in the 1970s to describe vegetation communities with similar plants, soils and climate. A review of known or historic presence of wildlife or fish, particularly endangered or critical species and the associated habitat values on site as well as connectivity to adjacent ‘green’ areas or greenways or corridors that may exist nearby. The specific physical conditions of a site can be described by aspect (cardinal orientation of a site), soil and bedrock materials, slope or grade, topography within the site itself, moisture and nutrient regimes and evidence of disturbances (fire, mass-wasting, flooding).
British Columbia has developed many tools for site assessment and these provide a good overview of the ecological factors considered for both terrestrial (ground) and aquatic (water) habitats/ecosystems. BC Government documents such as “The Field Manual for Describing Terrestrial Ecosystems” are available via the provincial inventory standards resource site. This document and the other resources and guides provided on this site provide a good overview of the elements and values that are considered in environmental assessments. The number of manuals and resources, guidelines and forms on this page indicate the amount of information and detail that is needed to understand, quantify and qualify the ecological condition for any given site.
The first step is describe and establish the geographical context of a site. Much of this work is completed as part of a desktop or research project prior to the commencement of the design of a study or work in the field. Elements that are often included in such a description include:
- Location and relative to position to well-known communities, site, landmarks or natural features;
- Jurisdiction and list stake holders who oversee and participate in management of site;
- Land ownership, and this includes acknowledgement of current ownership and historic cultural and un-ceded territory of First Nation communities;
- Description of weather patterns, variance between seasons and temperature and precipitation norms;
- Geological history of local region and geology and soil types found on site;
- Hydrological features that exist within or adjacent to and which influence conditions on site (lakes, wetlands, rivers, streams) and the watershed within which the site is located; and
- Biogeoclimatic zone(s) of area.
Depending on the intent or focus of a study, a site description may also include a history of disturbance or impacts that have altered the ecology and physical aspects of a site. This may be included in locations where the impacts on a site have resulted in changes to soils, to hydrological systems like stream location or water inputs and flow. The plant and wildlife species may also be quite different or have less diversity then one would expect to find given the region and climate where the site is located. The presence of invasive plants, unfortunately, often a by-product of human activity and global problem, are often included in the description of a site. These plants can greatly diminish biodiversity and alter the ecology of an area. If present on a site, biophysical assessments are often adapted to identify the species, locations, density and total area of invasive plants on a site. Approval for work or development on a site will often include the requirement to locate and remove invasive plants followed by remediation and replanting of native species.
Site Description Example
If we were to describe the Cheakamus Centre in this way, it would go something like this:
The Cheakamus Outdoor Education Center is located in Paradise Valley and the community of the District of Squamish which is itself a part of the larger Squamish-Lillooet Regional District. The site is accessed off the Sea to Sky Corridor Highway Route 99 and is approximately 80 km north of Vancouver, British Columbia. The Centre operates on 165 ha property owned by the North Vancouver School District and is both an education facility and a nature reserve, the latter managed in partnership with the Nature Conservancy of Canada (NCC). The property is located on the traditional territories of the Chi’yakmesh people of Skwxwú7mesh (Squamish) Nation and is a part of the newly designated Átl’ka7tsem/Howe Sound UNESCO Biosphere Region. Additional stakeholders, regulating government agencies and industry partners that participate and have interest in the site include but may not be limited to the Federal Department of Fisheries and Oceans (DFO), Ministry of Forests, Lands, Natural Resource Operations, BC Hydro and the Squamish River Watershed Society.
The Cheakamus River watershed has a moderate coastal climate with seasonal temperatures ranging from an average of 18°C in July to an average of 1°C in January. The area receives upwards of 1400 mm of precipitation per year (Climate Data 2020). High precipitation and snow at upper elevations during the fall, winter and early spring periods in the larger mountainous watershed result in high flows during spring snowmelt with peak levels occurring in June or early July (FWCP 2020). Summers are typically warm and relatively dry and the lowest water levels occur during this period. Intense fall storms can cause large influxes of water into the Cheakamus River resulting in high flows and sediment levels (FWCP 2020).
The Cheakamus Centre is located within the Squamish River watershed. The property is bound along the northern and eastern portions by the Cheakamus River and a continuous dike runs between property and river edge. The site is located approximately 20 km downstream of the BC Hydro Daisy Lake dam. Built in 1957, the dam significantly altered water flow and water levels in the Cheakamus River (BC Hydro Fish Wildlife 2002). The regulation of water flow negatively impacted downstream salmon habitat and there has been significant investment in salmonid habitat restoration over the past several decades (BC Hydro Fish Wildlife 2002).
The site is in located within the Dry Maritime Coastal Western Hemlock biogeoclimatic subzone (CWHdm) and has vegetation that is consistent with the CWHdm designation (Government of British Columbia 2020). The section of Cheakamus River and the lower elevation areas of the property rest on an alluvial floodplain over Quaternary sediment (Clague et al. 2002). The site is divided by from North to South by both the Paradise Valley Road and a major electrical utility corridor. The portion of the property located to the east is located within the floodplain and the bulk of the section to the west is heavily forested and dominated by steep slopes. There are a number of buildings located on eastern portion of the property that function as offices, food services, cultural and education spaces as well as residences for onsite staff. A series of gravel road sections transect property, link buildings and provide several access points to eastern section of property off Paradise Valley Road. An extensive trail network provides access to both east and west sections of site. As the site is private property and managed as ecological reserve, access is limited and no trespassing signage is posted along road. (Note that this last point is relevant because limited public access will facilitate some sampling on site such as the use of wildlife cameras along trails)
(Note: Text for this section are adapted from the Nature Conservancy of Canada website, the Cheakamus Centre website and the 2021 FWR Biophysical report completed by Alexandra Mullins, Michelle Chase, Michael Cowman and Jun Almonte).
A study design for a biophysical assessment at the Cheakamus Centre
Given the many aspects of the site that could be measured, monitored, impacted by development and enhanced with restoration work, the first challenge in creating a good design for a biophysical inventory at this and any site would be to clearly define the goals and objectives of the study. In other words, what do you hope to achieve and what information do you need to complete your task? Biophysical inventories can be multi-faceted and datasets can meet multiple objectives – the goal is to create a repeatable and efficient method to capture necessary information for current and future purposes. For example, the baseline inventory may establish dominant plant species, biodiversity, age and vegetation structures within similar areas or zones of a study site (often called stratum in these kind of surveys). Over time or after a change occurs on site, such as the construction of a building and associated infrastructure like roads or utilities, the study can then be repeated and the degree of change, from an ecosystem perspective, both positive and negative, assessed.
If you look at the local and regional government development application processes in the Squamish area, you can get a sense of the requirements for environmental assessments that would apply to a location like the Cheakamus site. At a local level, the District provides several terms of reference documents related to environmental assessments. These include soils, tree removal, natural hazards, invasive plants and a site bio-inventory. Within the site bio-inventory, the document refers the Qualified Environmental Professional or QEP and the project proponent to the Provincial Environmental Guidelines for Urban and Rural Land Development for additional context and resources.
As you can see in both the local and provincial documents and resources, there are many, many aspects to consider here. While not all may apply, the QEP and property owner or project lead is responsible for addressing all relevant concerns and elements that may exist on site. Both the province and relevant professional associations, such as the College of Applied Biologists, provide guidelines and resources for environmental professionals with regards to assessments and their legal obligations when conducting a site assessment. Sometimes the requirements may overlap jurisdictions or even seem contradictory and the Canadian Council or Ministers of the Environment (CCME) is another important resources for standards for assessment of habitat as well as coordination between jurisdictions and regulating agencies and levels of government.
Many First Nation communities are creating and implementing their own environmental assessments, consultation processes and land management guidelines (see Squamish Nation Rights & Title section). For any assessment on lands in BC and Canada, consultation with, and the inclusion of First Nation perspectives greatly benefits, and is many cases, is required, for designing and conducting environmental assessments. The BC Treaty Commission has developed an interactive map of First Nation Treaty Intent Boundaries. The British Columbia Assembly of First Nations also shares a map of First Nation communities by region if you are interested in learning more about the many communities and lands throughout province.
For our purposes here, we are going to focus on the assessment of aquatic habitat for salmonids on the Cheakamus site as an example of a biophysical inventory with a specific purpose and focus.
Aquatic: A biophysical inventory of fish habitat values
A study of the habitat values within a specific area of the Cheakamus Centre property took place in the fall of 2020 and winter of 2021. Students from the Fish, Wildlife and Recreation Diploma program at BCIT focused their efforts within the Dave Marshall Salmon Reserve (DMSR) located at the north end of the site. The reserve and salmonid spawning and rearing channels were created by the DFO and the Province. BC Hydro funded the project as compensation for loss of salmonid habitat following the construction of the Daisy Lake Hydro Dam project and regulation of water levels in the Cheakamus River.
Salmonids have specific requirements for spawning and rearing habitat and while it varies across the five important fish species that use this system there are enough commonalities that we can design a study to assess habitat values for multiple species. The four salmonid species are: (i) chinook (Oncorhynchus tshawytscha); (ii) chum (Oncorhynchus keta); (iii) coho (Oncorhynchus kisutch); and (iv) pink (Oncorhynchus gorbuscha). The one trout species is steelhead (Oncorhynchus mykiss). Steelhead are the ocean going relatives of the freshwater system rainbow trout. Each of these species of fish have different preferred spawning and rearing habitats and their migration patterns, life cycles and access and use spawning channels and emergence of fry vary by year, region, and river system.
Fish require adequate water flow, oxygen levels, low turbidity (levels of sediment in the water column), gravel substrate (bed material of stream) with low fines/silts in interstitial spaces and instream cover from high stream flows and predators. They also have a preference for specific temperature ranges (not to hot and not to cold). Salmon require a consistent or at least connected system where fry (salmon young) will not be trapped or isolated during dry periods and redds (salmon egg masses buried in gravel) remain under water and oxygenated until fry emerge in spring. Adjacent vegetation in areas adjacent to the stream (riparian areas) provide shade, regulate water temperature, and are a determinant factor in insect life and food source for young salmonids.
The Fish Habitat and Assessment Procedures (FHAP) were developed by the Province of BC in the mid-1990s as a response to the impacts of logging on streams and associated fish habitats. This set of procedures is a form of an environmental assessment that looks specifically at values related to fish and fish habitat needs. Such a study usually entails both a survey of the physical habitat (stream location and dimensions, bed material or substrate, water quality and instream habitat features) and the biota within the stream (fish surveys, benthic invertebrates or bugs that live within or on the substrate).
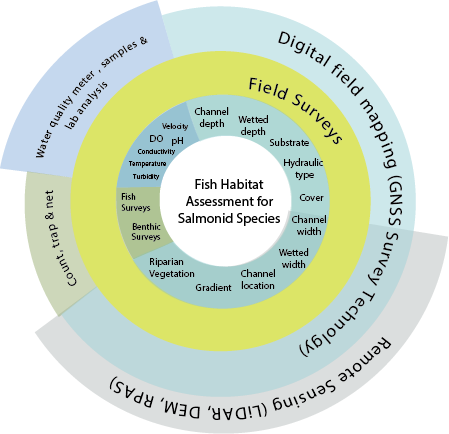
The graphic to the left illustrates the main elements of a fish habitat assessment that captures key physical and biological elements of a stream survey for salmonid use and habitat needs. Note that the technology or tools that can be used to capture the different elements of a fish habitat assessment are identified on the outer circles.
Fish habitat assessments were traditionally done with aerial imagery, contour maps and paper field forms. Advances in technology and a greater access to imagery and digital technology. An example of this is the use of digital survey equipment that records accurate positions and geo-references data observations using the Global Navigation Satellite System.
In the study completed on site in 2020/2021, BCIT students used GNSS, fish surveys, RPAS, GIS and LiDAR to assess habitat. Students designed a digital survey form and walked the channels with high end GNSS survey equipment and used the provincial standards for GPS surveys to achieve a 2-5 metre accuracy for their line and point feature locations. They recorded their observations in the GNSS unit and digital form for section of stream that had the same characteristics. Each time a value changed for any of the elements measured in the channel, for example wetted width or channel depth, they would segment or break the line and create a new section with the new value.
In map series presented below, the map on the right illustrates the values for two adjacent sections of stream sections and the habitat values observed during the field assessment surveys. The map on the left was created with a digital elevation model or DEM of the DMSR created from LiDAR obtained with a drone or Remote Piloted Aircraft System (RPAS). The objectives for this study were to complete an environmental assessment and assess the efficacy of LiDAR and RPAS technology for identifying and measuring specific aspects of fish habitat within a forested area.
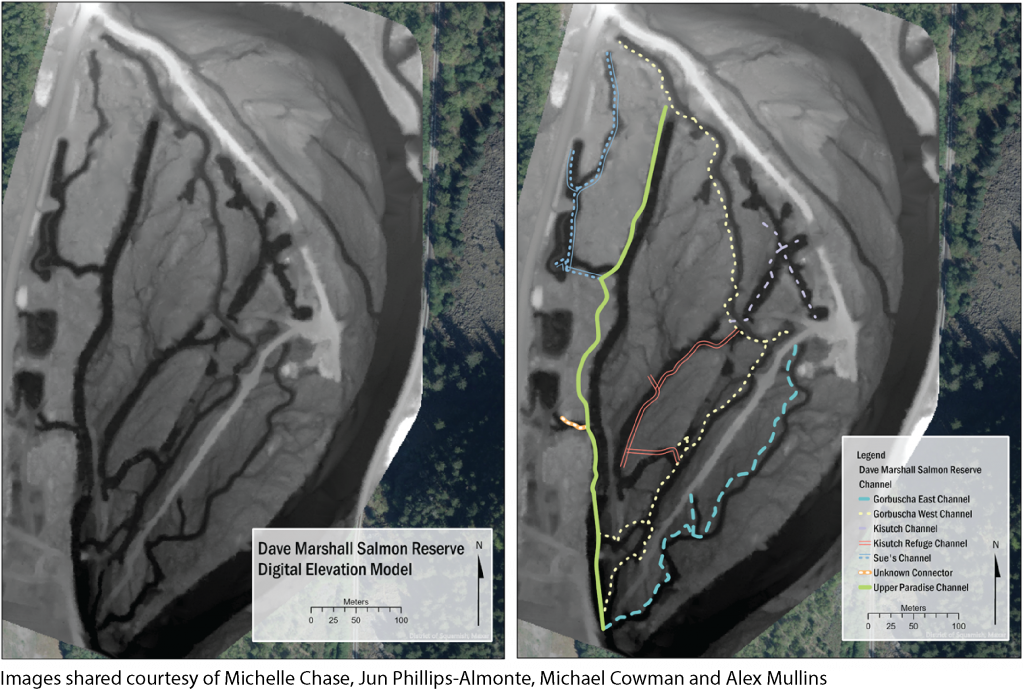
As you can see in the image on the right, the channels are clearly demarcated and it is also possible to see the many smaller channels that crisscross the reserve area, many not visible to or accessible for the field crew. While it is not possible to assess some habitat features, such as substrate, wetted or channel depth, cover or hydraulic type (run, riffle, or pools) with the LiDAR derived DEM, it is possible to locate the channels and measure channel width. Wetted width is problematic as the color or reflected value within the channel may not be indicative of wetted area but rather sediment load or leaf litter.
There are limitations to the application and use of all data derived from environmental assessments. Observations in the field are often a ‘snapshot’ of conditions that exist for a brief period of time during a field site visit. It is almost impossible to create a survey or study without some bias or introduction of an aspect that introduces a degree of uncertainty in our results. For example, our passage up a creek and presence in a forested area is in and of itself, a disturbance – something unusual and separate from the larger ecosystem. As a result, fish and animals will avoid us, hide or leave the area and this creates a bias if we are relying on our field visit to assess wildlife or fish presence in an area. Fish traps can be set to assess presence of fish species, point counts for birds where the observer is still for several minutes before beginning their survey, or the installment of wildlife cameras triggered by movement are three examples of methods that could be used to remove the bias of our presence from an assessment of populations and presence within a site.
Even with such adaptation, our assessment of something does not equate to our understanding of the causal relationships and connections that exist within an ecosystem. In a biophysical site assessment, we may find a correlation between two events or two features within a site or area in that they tend to occur together or perhaps they tend to occur in absence of one another. The discovery of the cause for this relationship, and a confirmation that it truly exists, would require many repeat visits over an extended time period and fall in the category of a research project rather than a site assessment. This is an important limitation to recognize for site assessments as they serve a function for inventory of what is rather than an understanding of the function and relationships that exist on a site.
Media Attributions
- Cheakamus Site Map Fig01 © Laurie Stott
- Example Site Map Series Fig 02 © Laurie Stott
- Fish Habitat Data Collection © Laurie Stott
- LiDAR DEM and GNSS Fish Habitat assessment 2020 © M. Chase, M. Cowman, A. Mullins and J. Phillips-Almonte
