Response Curves
The species groups and life stages in any Ecospace model will only respond to environmental conditions and habitat features as discussed above via group-specific response curves (also known as environmental preference functions). The application of these response curves makes a cell more or less suitable for feeding by adjusting the size of the Ecosim and Ecospace foraging arenas and thus controlling the consumption rate of a species in that cell (Christensen et al., 2014).
Generally, the response curves are constructed from in-situ monitoring data, lab experiments, and through statistical analysis of species occurrences versus observed environmental conditions. In many fisheries independent monitoring programs, water quality and habitat data are collected at the time of sampling so creating these curves is a straightforward process but using local or regional data implies that the response functions will not be able to be used for other ecosystems (Coll et al., 2019; De Mutsert et al., 2021, 2017a, 2012). If current monitoring data are not available, published relationships between species and environmental parameters can also be a good resource. For example, responses to several environmental parameters are available worldwide from the free database AquaMaps (Kaschner et al., 2019). The use of AquaMaps response functions is ready to use in Ecopath with Ecosim models due to an AquaMaps-EwE link in the form of a plug-in freely distributed, and has been applied in several EwE applications (Bentley et al., 2020; Coll et al., 2020, 2016; Corrales et al., 2018, 2017). However, the limitation of this approach is that the response functions show a uniform distribution between the 10th and the 90th percentile, which can underestimate the impact of environmental change on consumption and thus deliver overly optimistic results.
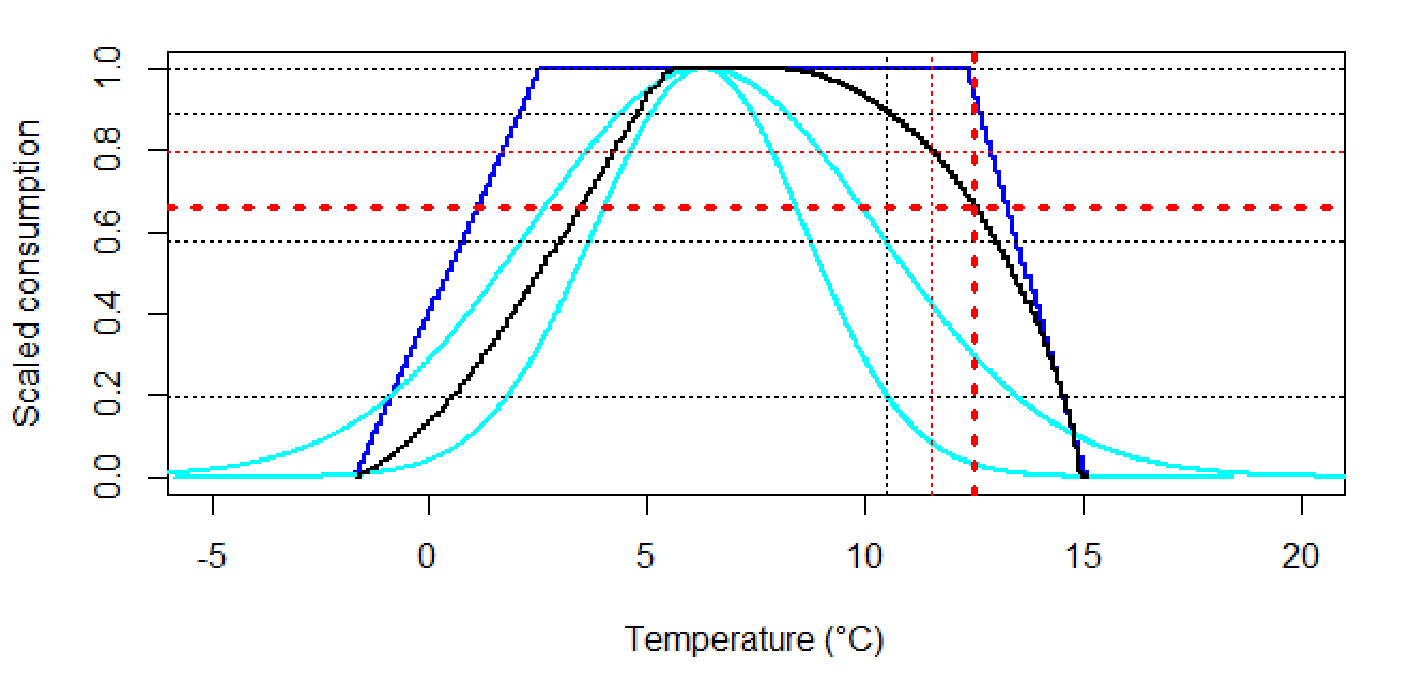
Other options include using a Gaussian distribution (Bentley et al., 2019, 2017; Serpetti et al., 2017), which considers a more sensitive niche envelope but can overestimate the environmental effect. Finally, expert knowledge could also be used to develop functional responses to environmental conditions, but their application should be well documented in the methods (Bentley et al., 2019; Coll et al., 2019; Corrales et al., 2017). Additionally, AquaMaps response functions can be refined by using regional rather than global distribution of observations used to calculate the functions and building the functions to represent environmental values of a specific region (Ouled-Cheikh et al., 2022). A sensible approach can be to test the effect of various response shapes since these shapes have an effect on the modelling outputs (Burrows et al., 2019; Waldock et al., 2019; Fig. 6).
There are a few important considerations to keep in mind when applying environmental responses:
- Use environmental responses only when necessary, applying the most important driver to the most sensitive groups only, and test how the entire food web responds. Build up complexity gradually and only where absolutely warranted to make the ecosystem as a whole respond to (changing) environmental conditions;
- Be wary of auto-correlation between drivers;
- Be careful not to over-constrain functional groups;
- Do not assume that a response curve for a multi-stanza group necessarily applies across all stanzas. Response curves should be developed for each life stage, given that many species have ontogenetic shifts in environmental preferences (De Mutsert et al., 2021, 2017a).
Adaption
The chapter is in part adapted, with permission, from:
De Mutsert K, Marta Coll, Jeroen Steenbeek, Cameron Ainsworth, Joe Buszowski, David Chagaris, Villy Christensen, Sheila J.J. Heymans, Kristy A. Lewis, Simone Libralato, Greig Oldford, Chiara Piroddi, Giovanni Romagnoni, Natalia Serpetti, Michael Spence, Carl Walters. 2023. Advances in spatial-temporal coastal and marine ecosystem modeling using Ecopath with Ecosim and Ecospace. Treatise on Estuarine and Coastal Science, 2nd Edition. Elsevier.
