Addressing Uncertainty
General Practices
It is generally a good practice – if not mandatory – to explicitly acknowledge sources of uncertainty in data and modeling exercises, make reasonable attempts to quantify it, and caveat the model results as appropriate.
An ever-increasing body of literature categorizes the various types of uncertainty related to the development and operation of ecosystem models (Cariboni et al., 2007; Harwood and Stokes, 2003; Payne et al., 2016; Spence et al., 2016; Steenbeek et al., 2021). A useful typology is: (1) model / structural, (2) stochastic-, (3) data-, and (4) parameter uncertainty (Gregr and Chan, 2015). Model uncertainty occurs due to potential incomplete or inaccurate abstractions embedded in the structure of the model. Ensemble modeling approaches can be an effective approach to better understanding uncertainty due to implicit architecture of a model: multiple models are used, each representing a different method of abstracting and representing the ecosystem, e.g., Scales et al. (2016), Spence et al. (2018), Lotze et al. (2019) and Tittensor et al. (2021). Structural uncertainty can also be explored using a single model by modifying model equations, for example by aggregating/disaggregating compartments, changing functional relationships and/or modifying basic function process, e.g., linear fishing mortality (Coll et al., 2020; Hansen et al., 2019; Pantus, 2007). Stochastic uncertainty occurs due to chaotic or ‘noisy’ process signals, non-stationary patterns and relationships between variables (Deyle et al., 2016; Litzow et al., 2018; Walters, 1987), or uncertainty in processes represented by the model (e.g., recruitment, (Spence et al., 2016). Data uncertainty results from measurement and observation error and can be propagated through a model due to the model fitting procedure. Parameter uncertainty arises due to non-unique parameter values that the modeler must choose from, as well the large number of parameters typically needed for ecosystem models.
The EwE approach provides some means to execute parameter uncertainty analysis (e.g., (Coll and Steenbeek, 2017; Heymans et al., 2016; Steenbeek et al., 2018). As the Ecospace module inherits model structure, parameters, and associated uncertainty from both Ecopath and Ecosim, we recommend using a formal fitting routine and sensitivity analysis in Ecopath and Ecosim (e.g., (Scott et al., 2016) before tackling uncertainty in Ecospace. To assess Ecospace model sensitivity due to the underlying parameterization of Ecopath / Ecosim, the Ecosampler module described in section 3.2 can be used (Steenbeek et al., 2018). The Ecoranger module in EwE 5 was a pseudo-Bayesian approach to search for parameters (Christensen et al., 2005; Christensen and Walters, 2004; Walters et al., 1997), though no Bayesian uncertainty analysis tool is currently built into EwE 6. One promising alternative is Bayesian-Species Distribution Models (B-SDM), which implicitly considers uncertainty in spatial distributions and environmental niches. This type of model can be used in a complementary manner with Ecospace to incorporate uncertainty in plausible habitat capacity, response functions or both (see Coll et al., 2019).
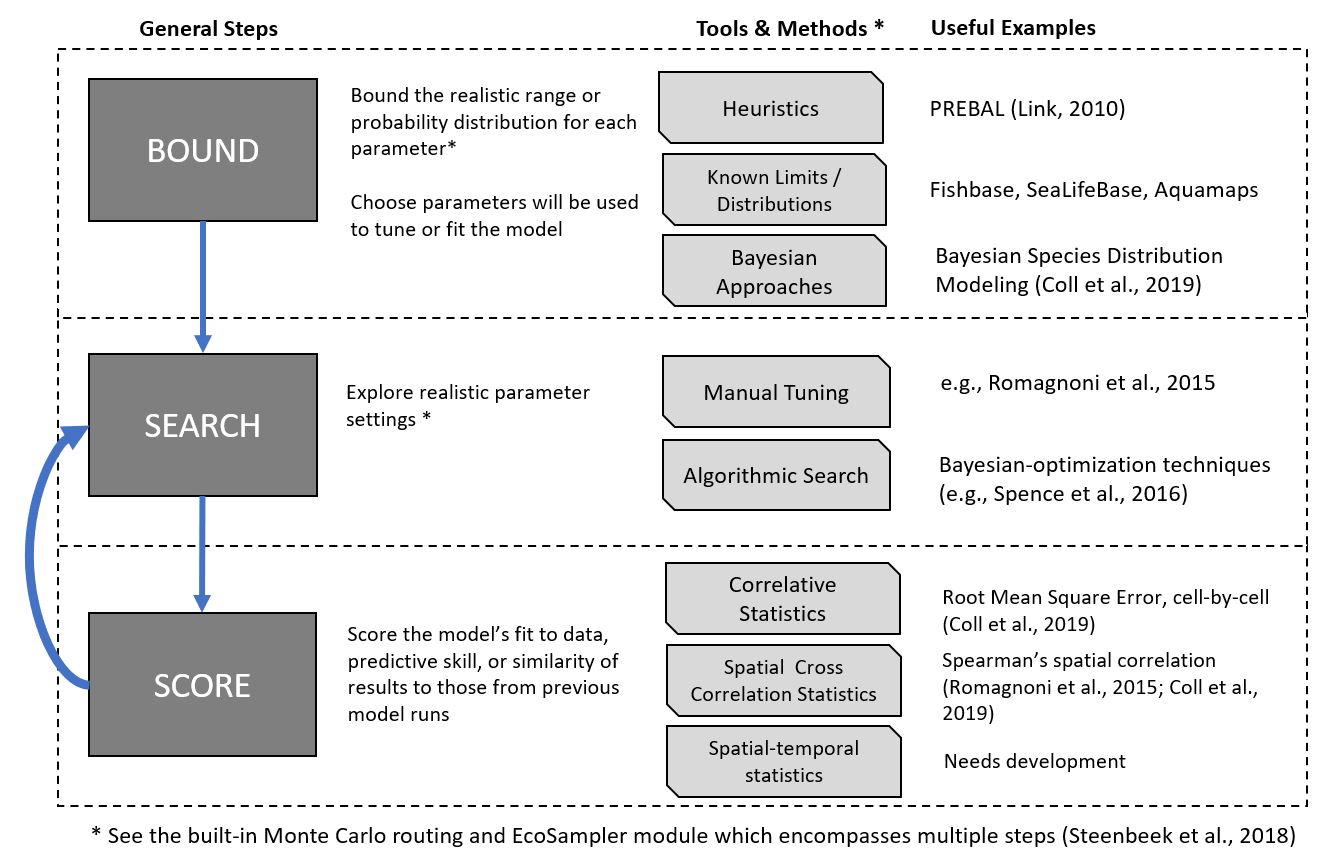
A ‘bound, search, and score’ generalized approach for tackling uncertainty due to data and parameter uncertainty may be intuitively familiar to most modelers and help to contextualize the various methods, tools, and statistics available to Ecospace users (Fig 9). This simple framework captures the general approach used in a previous ad hoc effort to parameterize Ecospace (Romagnoni et al., 2015).
The ‘bound’ step addresses issues related to computational cost associated with running Ecospace, a typical challenge with the complexity of most ecosystem models. In Ecospace, this must currently be done manually. We recommend selecting Ecospace parameters for sensitivity analysis based on: (a) importance to the questions, patterns, or processes being investigated, (b) those that are most frequently tuned, and (c) computational limitations and model run time. Common non-spatial parameters used to tune Ecospace models are the “vulnerability exchange rate”, “base dispersal rate”, “relative vulnerability to predation in bad habitat”, and “effective power of fishing fleets”. Key spatial parameters (those that vary between raster cells) may also be bounded using the spatial-temporal framework by importing raster data prepared in advance that represent habitat capacity (Coll et al., 2019; Steenbeek et al., 2013).
In Ecospace, the ’search’ step is currently limited to a manual search, since Ecosampler and the Monte Carlo routine are not yet able to access Ecospace parameters. However, the spatial-temporal framework makes it possible to easily run and re-run Ecospace using different spatial parameterizations, and the ability to run EwE directly from code greatly facilitates the repeated execution of model exercises to perform structural uncertainty analyses.
‘Scoring’ the Ecospace runs may be done in several ways. A simple approach is to use comparisons between Ecospace results from multiple runs. Currently, Spearman’s spatial correlation, which can be calculated using the ‘raster’ package in R using the “corLocal” function (R Core Team, 2018) is popular (Coll et al., 2019; Piroddi et al., 2022; Romagnoni et al., 2015; Subramaniam et al., 2022), while (Lynam et al., 2017) used Mantel spatial correlation with 999 permutations to test the significance level. To best address the task of comparing Ecospace outputs, a spatial-temporal statistical measure of similarity, or spatial-temporal cross correlation, is required. Unfortunately, spatial cross-correlation statistics in Ecospace are still under development and present computational and theoretical challenges (Chen, 2015). In the lack of such statistics, Püts et al. (2020) utilized a set of metrics for the temporal (Pearson correlation and root mean squared error) and spatial fit (Schoener’s D index) separately, finally combining them using a Taylor diagram.
Spatially-temporally explicit uncertainty assessments are a challenging priority for future development (Steenbeek et al., 2021). The development plans for EwE includes extending the parameters that can be perturbed by the Monte Carlo routine (and subsequently sampled by Ecosampler) to Ecospace (Steenbeek et al., 2021, 2018). Given the high computational cost of running a spatially resolved model such as Ecospace, the parameter search space (i.e. the range of the parameters to be explored, and their combinations) must be limited to a local instead of a global search (Hansen et al., 2019; Pantus, 2007; Püts et al., 2020), with the caveat of reducing the possibility of exploring extreme values and combination of parameters. Iterative, ad-hoc process for space reduction (e.g., see Romagnoni et al., 2015) are time-consuming when manually implemented, and automated procedures are not available at present. Preliminary understanding of parameter space is thus critical to make the analysis tractable.
Ecosampler
Ecosampler is a module within EwE to measure the impact of Ecopath input parameter sensitivity on its results (Steenbeek et al., 2018). Ecosampler records samples – alternate mass-balanced parameter sets for a food-web model – from the built-in Monte Carlo routine, and replays these samples through all of the EwE modules and any loaded plug-in. Ecosampler can capture output variation due to base input parameter sensitivity of any computational component including the temporal module Ecosim, the spatial–temporal module Ecospace, and plug-ins such as Ecological Network Analysis, Value Chain, and Ecological Indicators (Fig. 10).
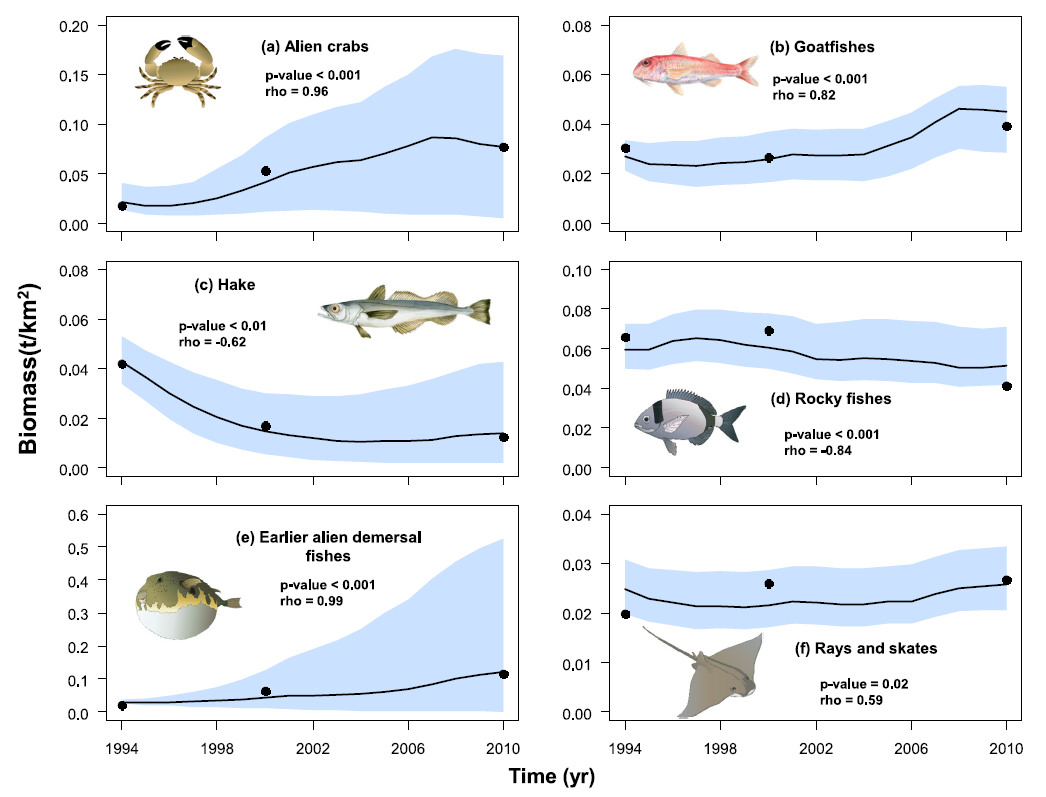
Image attributions?
Adaption
The chapter is in part adapted, with permission, from:
De Mutsert K, Marta Coll, Jeroen Steenbeek, Cameron Ainsworth, Joe Buszowski, David Chagaris, Villy Christensen, Sheila J.J. Heymans, Kristy A. Lewis, Simone Libralato, Greig Oldford, Chiara Piroddi, Giovanni Romagnoni, Natalia Serpetti, Michael Spence, Carl Walters. 2023. Advances in spatial-temporal coastal and marine ecosystem modeling using Ecopath with Ecosim and Ecospace. Treatise on Estuarine and Coastal Science, 2nd Edition. Elsevier.
