Biomass Emitter
Jeroen Steenbeek and Marta Coll
How Does it Work
Dedicated models of Marine Protected Areas (MPAs) can only be used to adequately represent the local effects of MPAs, as these models are created at sufficient spatial scales to allow species to thrive and disperse within the MPA. Coarser models do not have the cell resolution needed to reflect these dynamics, which has been a limiting factor to deciding on spatial scales of EwE models.
The Biomass Emitter is a lightweight plug‐in to the Ecopath with Ecosim food web modelling desktop software, intended to incorporate MPA biomass effects into models with insufficient spatial resolution to properly calculate the workings of the MPAs.
The Biomass Emitter's plug‐in provides two pathways to incorporate fine‐scale dynamics into larger models:
- from finer‐scaled models where MPAs are explicitly modelled, or
- from empirical rules that emulate the workings of the MPAs in absence of detailed MPA models.
We describe each of these options in the following.
Using Detailed Models
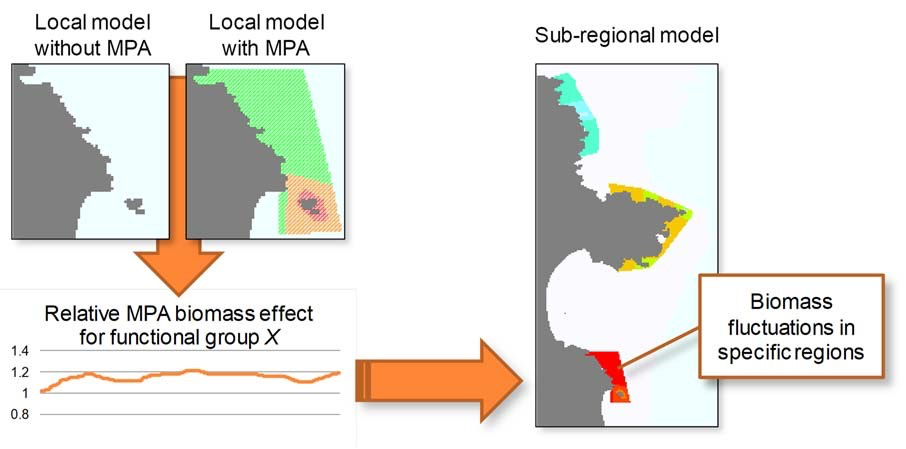
To the transfer biomass effects of local features, obtained from dedicated fine‐scale spatial models, the emitter uses time series of biomass effects for selected functional groups (Figure 1). These time series capture either relative or absolute change in biomass within the area of an MPA as computed by a dedicated MPA model:
- Relative biomass trends for use in the Biomass Emitter are calculated as follows,
[latex]\Delta B_t = {\bar{B}_t^1}/{\bar{B}_t^o} \tag{1} \label{eq1}[/latex]
where ∆𝐵t is the relative change in biomass within an MPA area at time step t; [latex]\bar{B}_t^1[/latex] is the mean biomass of this group within the same MPA area at time step t extracted from an Ecospace where the MPA was active; and [latex]\bar{B}_t^o[/latex] is the mean biomass of the same group within the same MPA area at time step t extracted where the MPA was not enforcing any fishing limitations.
- Absolute biomass trends can be obtained directly from regional average‐saved data.
The biomass trends needed to parameterize the Biomass Emitter can be calculated from Region Averaged CSV files, a data format natively produced by the EwE software, through a utility included with the Biomass Emitter plug‐in (see below). Emission files have the following layout:
| group | 1 | 1 | 1 | … |
| target | 1 | 2 | 3 | … |
| 2015‐01 | 2 | |||
| 2018‐01 | 2 | |||
| 2020‐01 | 2 | |||
| … | ||||
| Table 1 ‐ an example of a biomass emission data file | ||||
Each column identifies biomass fluctuations for a single group and target area over time, where the target area can identify either a region number or the sequential index of an MPA in the coarse scale model where the data is applied. Time is entered in absolute terms as ‘year‐month’, and similar to Ecosim time series, emission values are allowed to be missing. When Ecospace runs, for every time step that a biomass emission value is defined, biomasses of the target group in all cells that fall within the target area will be multiplied by (relative), set to (absolute) or increased by (additive) the emission value.
Using Emission Rules
When local MPA models are not available, and biomass trends thus cannot be obtained from localscale dedicated MPA models, the Biomass Emitter offers the ability to include biomass effects of the fine‐scaled MPAs as follows:
[latex]\Delta B_t = 1 + m \cdot min(1, max(0,\frac{9-n}{5})) \tag{2}\label{eq2}[/latex]
where ∆𝐵 is the relative change in pool biomass at time step t; m is the maximum biomass effect that the MPA can achieve based on the MPA protection category as defined by e Costa et al. [1]; n is the cluster size (e.g., the number of connected target cells) of the target MPA. The cluster size correction dampens the emission effect when the MPA cluster increases in size, accounting for the fact that Ecospace requires at least 9 cells to mathematically represent the workings of an MPA. The max cluster size assumption is rather crude, and may need refining in the future. The maximum biomass effect m defaults to 5% biomass increase for fully protected areas, 3% biomass increase for highly protected areas, and 1% biomass increase for moderately protected areas, per month. Values of m can be customized.
Using the Biomass Emitter
Settings Page
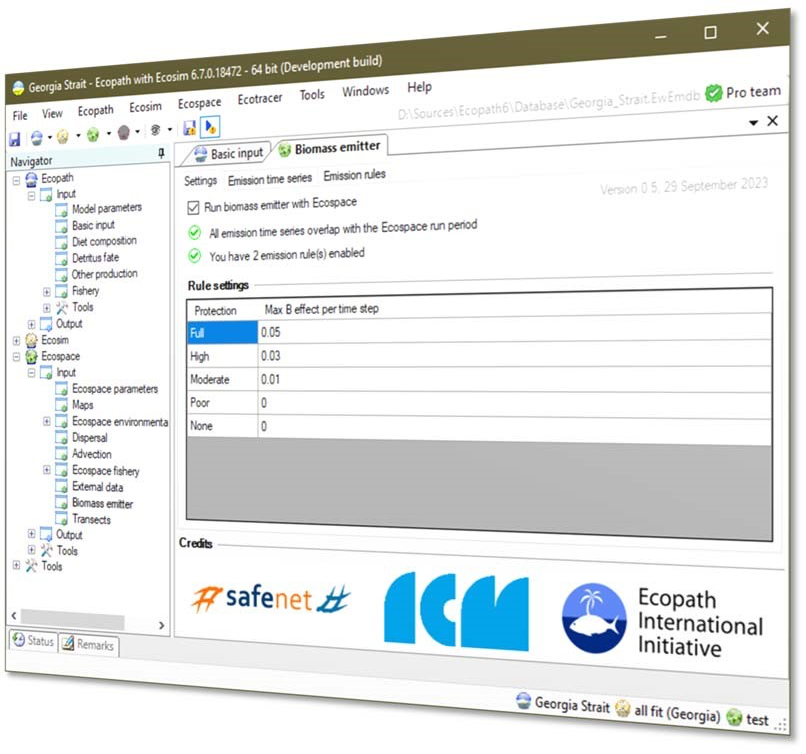
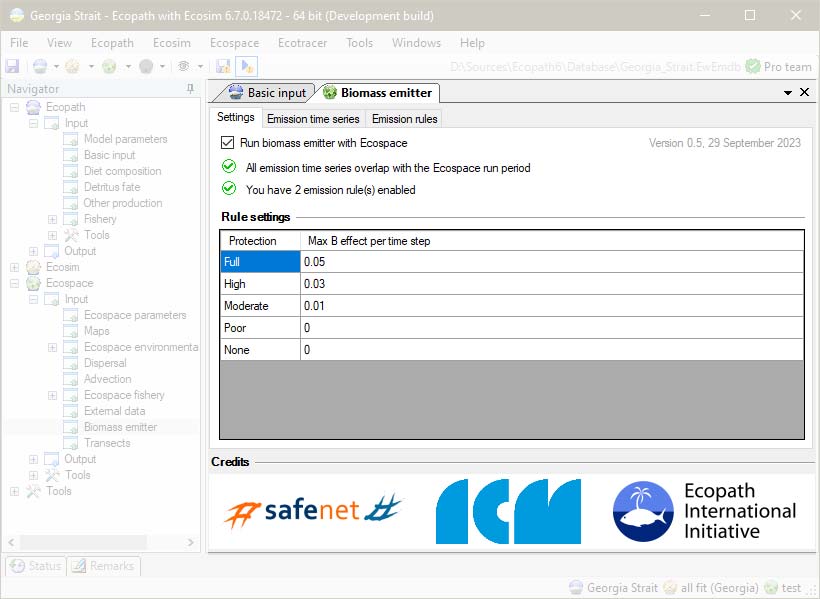
Once the Biomass Emitter plug‐in is installed, it can be launched from Navigator > Ecospace > Input > Biomass emitters. This brings up main settings page of the plug‐in (Figure 2):
The settings page is where the biomass emitter is enabled or disabled, where to check for possible conflicts, and where one can enter custom values of m (2) for different categories of protection. Custom values of m are stored with the system‐wide settings for EwE.
Using Emission Time Series
This emission time series configuration page shows all controls for loading (open folder symbol), unloading (Reset), and generating (magic wand) model‐derived biomass emission time series (Figure 3). Loaded biomass emission time series can be applied to target Ecospace Regions, MPA or Habitats, and can be applied as relative (e.g., multiplied onto per‐cell biomasses), absolute (e.g., overwriting per‐cell biomasses) or additional (e.g., adding to per‐cell biomasses).
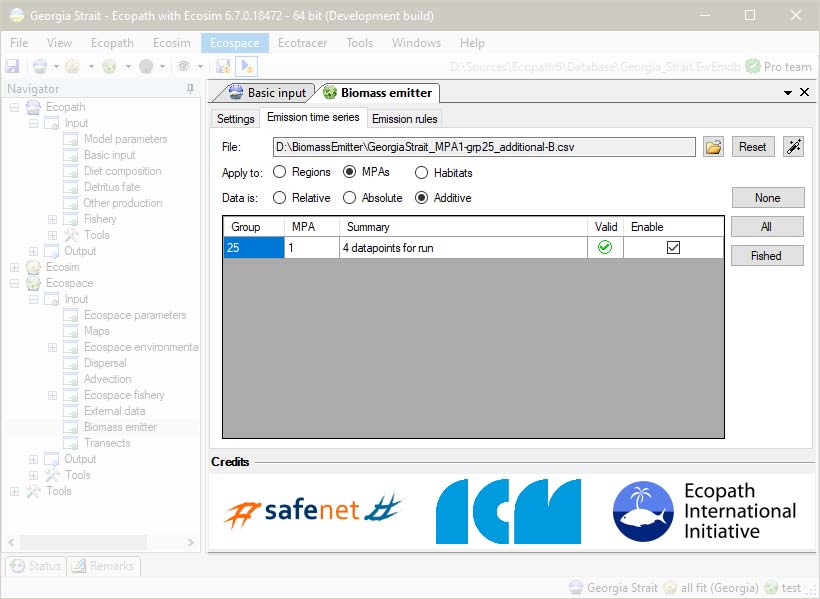
For all loaded time series, the interface shows whether target group and area index are valid for the currently loaded Ecospace scenario, how many emission values fall within the current Ecospace run, and which emission time series are enabled. Emission time series data points are matched by absolute dates. Biomass emissions can be applied per time step, presuming that the Ecospace time step size is left at monthly defaults.
The buttons labelled None, All, and Fished are used to quickly enable or disable emission time series. Note that the fished option functions differently depending on the type of area the time series emissions will be applied to. When applying time series to regions or habitats, the fished option will enable all emission time series for fished groups.
- When applying emission time series to MPAs, the fished option will enable only those time series that apply to groups that are fished by at least one fleet that is restricted by the indicated MPA.
- When applying time series to habitats, the emission amount is scaled to the habitat cell area coverage [0,1].
Using Emission Rules
The emission rules page requires users to specify, for each MPA in the loaded Ecospace scenario, the level of enforcement and whether a biomass emission rule needs to be applied to that MPA (Figure 4). The assigned enforcement level effectively selects one of the pre‐defined m values for use in equation 2. Just like time series‐based emissions, emission rules are applied at every time step.
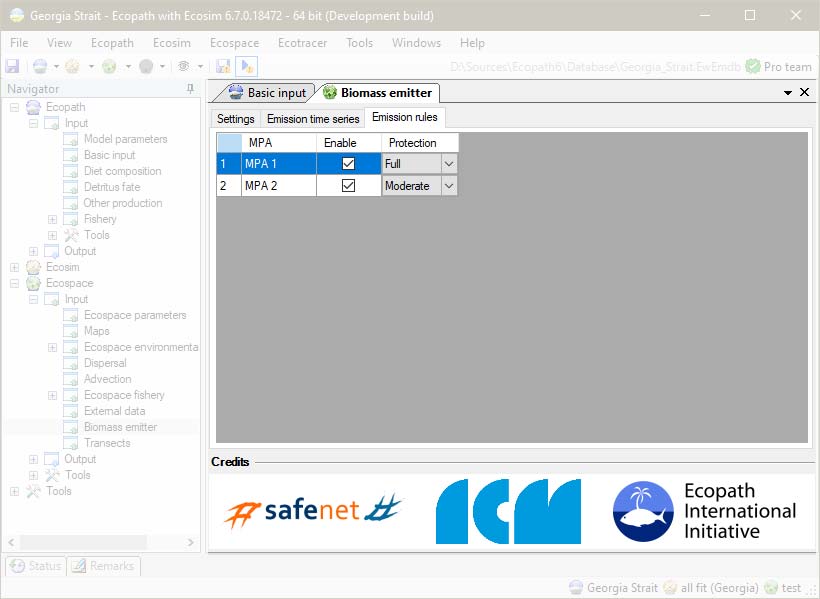
Note that rule‐based emissions are applied to MPA cells only, and within each MPA, only to those species that are being caught or discarded by fleets prohibited from fishing at the specific time step.
Generating Biomass Emission Time Series CSV Files
Biomass emission time series CSV files can be created by hand, or can be generated from regional average CSV files that Ecospace can auto‐save on demand with a utility provided with the Biomass
Emitter plug‐in according to the following workflow:
- In EwE, load the model for the dedicated MPA, load Ecospace, and enable auto‐saving of Region Averaged CSV files;
- Define regions for every MPA in the Ecospace model (Menu > Ecospace > Define Regions);
- Run Ecospace with protection measures ENABLED (e.g., all relevant MPAs are configured to enforce some kind of protection scheme onto at least one fleet in the model for at least one month of the year);
- If you wish to generate Relative Biomass Emission time series, continue with step 5. If you wish to generate Absolute Biomass Emission time series, skip to step 8;
- Change the Region Averages folder name so that it starts or ends with “after” (e.g., Subregional_01667dd_region_averages_after);
- Disable all MPAs, and run Ecospace with protection measures DISABLED;
- Change the Region Averages folder name so that it starts or ends with “before” (e.g., Subregional_01667dd_region_averages_before);
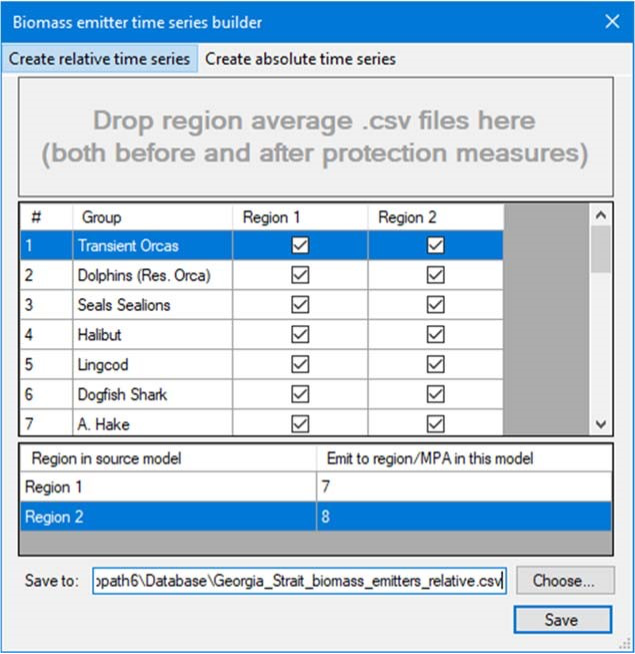
- In EwE, load the model where emissions need to be sent to. Load Ecospace, and launch the Biomass Emitter Time Series Builder (either by clicking in the Biomass Emitter plug‐in settings page, or by selecting EwE > Menu > Tools > Biomass Emitter Time Series Builder). This brings up a form as shown in Figure 5;
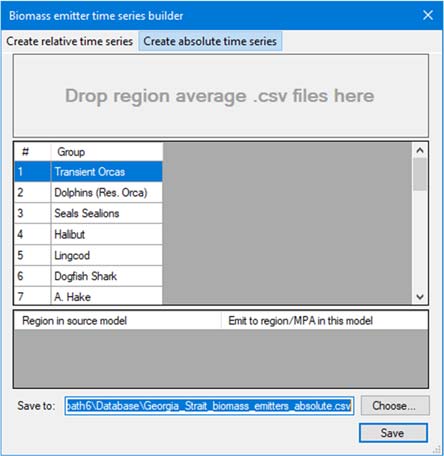
- Drop the single region averages folder for creating Absolute Biomass Emission time series, or both the “before” and “after” folders for creating Relative Biomass Emission time series, onto the target area in the time series builder utility;
- Select which target area the emissions need to be sent to. This can be either a region number or the sequential number of an MPA;
- Select an output folder and file name, and click Save.
When dropping the folders with region averaged CSV files, the time series builder performs a number of checks:
- Only monthly averaged biomass files for specific regions are processed (e.g., files with names such as “Ecospace_Average_Region_*_Biomass.csv”. Files for annual averages, files not specific to a region, and non‐biomass averages are ignored;
- Group names from the fine MPA model (as written into the column headers in the region average biomass CSV files) are resolved to groups with the same name in the coarser model for which the emission time series are being created. Group name checks are not case sensitive, but spelling must be identical;
- For relative time series, both before and after folders are checked if they contain averages for the same regions. Only then can relative time series be computed.
Figure 6 shows the biomass emitter time series builder, ready to generate relative biomass emission time series, where source regions are mapped to desired target emission regions.
Note that the EwE status panel shows a history of generated emission time series files.
Also note that when the biomass emitter time series builder is launched from the EwE menu, it will act as a stand‐alone utility used for generating any number of emission time series files for a EwE model in general. When launched from the biomass emitter plug‐in, the time series builder will launch to deliver one specific emission file that can be directly integrated into the emitter plug‐in.
References
The biomass emitter was built under 2015‐2019 DG Mare funded project SafeNet: Sustainable fisheries in EU Mediterranean waters through network of Marine Protected Areas.
- Bárbara Horta e Costa, Joachim Claudet, Gustavo Franco, Karim Erzini, Anthony Caro, Emanuel J. Gonçalves. 2016. A regulation-based classification system for Marine Protected Areas (MPAs), Marine Policy 72: 192-198, https://doi.org/10.1016/j.marpol.2016.06.021 ↵
