Ecopath Input
The first task in building an ecosystem model is to clearly define the question(s) that the model is to answer. Once this is in place, it becomes much clearer what the model structure should be like. Assuming that is done, you can go ahead with the practical aspects of getting your model defined in EwE. That's what this chapter deals with.
Before entering data, you are encouraged to read the introductory material on the mass balance approach to ecosystem modelling for information about how the input parameters are used in the model.
Be aware that generally, leaving an input blank on a data entry form implies it is unknown. For some required parameters defaults are supplied and leaving such in place means accepting the default values. This is for instance the case for biomass accumulation, detritus import, landings, discards, migrations and prices (for all of which the default value is 0). You should be aware that opting for default values is as much a modelling decision as setting values – default values will not necessarily be appropriate for your model. But one upside is that you generally don't have to explain the EwE default values when publishing your model.
Model Parameters
The Ecopath > Input > Model parameters form is used to define some basic settings and record basic information about your model.
Model
This descriptive part is for recording some basic information, including the model area (in km2). All model stock sizes and flow rates are expressed per unit area (km-2), and stock and flow calculations in Ecopath, Ecosim, Ecospace and Ecotracer are all expressed per that unit area. There is, however, one exception. The value chain analysis works with quantities, so it, e.g., sums of how much the landings (in t km-2 year-1) are for the ecosystem in question and then multiplies this with the model area (km-2) to get the quantity (t year-1). The value chain will then work with these quantities for all calculations. It makes sense, once the seafood is landed, the quantity is what matters, not how big the area was it came from or what the densities were in that area.
The spatial extent (N, S, W and E) can also be entered here. If this is done, the area will be known in Ecospace where it is used to calculate the cell dimensions considering the model latitude.
Classification
If values are selected here from the drop down listings, the information can be used by the ecosystem model collection in Ecobase, Related, when you have published an Ecopath model, you are strongly encouraged to submit it to Ecobase. This can be done from the menu File > Export model > To Ecobase. Ecobase models are available at www.ecobase.ecopath.org and can also be downloaded directly from File > Import model > From Ecobase.
Basic Input
We provide only a cursory introduction and explanations for the various input fields as many are self-explanatory.
Define Groups
You must define whether a functional group is a primary producer, consumer or detritus by checking the appropriate box.
- Primary producers (producers) obtain all of their energy from photosynthesis. By definition, their trophic level is 1.
- Consumers obtain their energy by consuming other organisms. They have trophic level > 1.
- You must enter at least one detritus group and you can have as many detritus groups as you like. Detritus groups must be placed after all living groups (i.e., they must have a higher group number than the last living group). You must also specify where the surplus detritus (left over after feeding by detritivores) will go using the Ecopath > input > Detritus fate form.
Define Multi-Stanza Groups
To define a multi-stanza group, add the stanzas as separate groups using the Insert button. Note that each stanza must have a unique group name (e.g., Juvenile cod; Adult cod). Name the multi-stanza group as a whole (e.g., Cod) in the Multi-stanza group name column. Once you have created a multi-stanza group name, it is added to a pull-down menu in the Multi-stanza group name column. Enter the start-age of each stanza in months in the Stanza age (in months) column. Note that your youngest stanza must have a start-age of zero months. If you do not have an age-zero stanza, Ecopath will set the youngest stanza’s start age to zero (a message box will inform you of this). After defining a multi-stanza group(s), you must set the values of additional parameters for the group(s).
Edit Multi-Stanza Groups
Multi-stanza groups represent life history stages or stanzas for species that have complex trophic ontogeny. Mortality rates (M0, predation, fishing) and diet composition are assumed to be similar for individuals within each stanza (e.g., larvae having high mortality and feeding on zooplankton, juveniles having lower mortality and feeding on benthic insects, adults having still lower mortality and feeding on fish). For Ecosim and Ecospace it is advised to split groups of special interest into multi-stanza groups as this makes their dynamics more realistic, provides insights on stock-recruitment relationships, and allows consideration of stanza-specific habitat use.
Once you have defined a multi-stanza group(s) you must go to the Ecopath > Input > Basic Input > Edit multi-stanza form to set the parameters needed to calculate the biomass and numbers in each age category.
You must enter baseline estimates of total mortality rate Z (i.e., P/B) and diet composition for each stanza, and biomass and consumption/biomass ratio (Q/B) for one 'leading' stanza only (can be any stanza). Biomass and consumption are then computed for the other stanzas, assuming a stable age distribution.
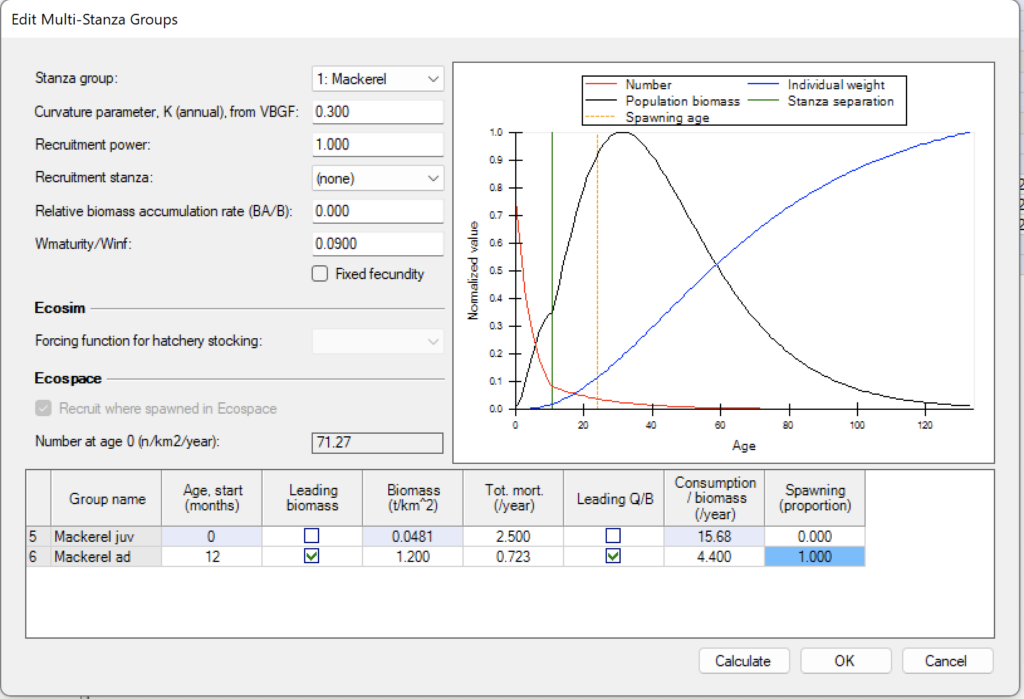
Curvature Parameter, K
Set the von Bertalanffy growth rate. Note that it is assumed that body growth for the species as a whole follows a von Bertalanffy growth curve with weight proportional to length-cubed.
Recruitment Power
This parameter is used by Ecosim and sets the degree of density dependence in juvenile survival for juveniles outside the modelled area.Set a low value, (e.g., 0.1-0.5) for this parameter if the juveniles for a group spend some time ‘outside’ the system in a nursery area where they are subject to density-dependent juvenile mortality rate, (e.g., juvenile Pacific salmon abundance may be limited by freshwater nursery habitat, so that numbers recruiting to a coastal oceanic area can be practically independent of adult abundance in the oceanic area, especially if juvenile production is ‘enhanced’ by hatchery systems).
Note that you should not need to change other basic parameters defining trophic ontogeny for split groups. When it is the very early juvenile stage that is spent in some rearing habitat outside your modelled area (e.g. a stream or coastal lagoon), you may model the effect of limiting factors within that rearing habitat just by adjusting the recruitment power parameter, without bothering to accountfactors such as ‘Import’ of food to the juvenile biomass while juveniles are in the rearing area (cumulative effect of such trophic development are automatically calculated when scaling the juvenile body sizes within Ecosim based on Ecopath juvenile pool biomass).You can also use a low recruitment power parameter to make juvenile recruitment ‘flat’ with respect to modelled adult biomass due to recruitment of juveniles from some adult population ‘egg source’ outside the modelled area.
Recruitment Stanza
Is used only for coupled stanza groups, where, e.g., males and females are modelled as separate stanza groups, (see linked stanza recruitment). In that case one can let the recruitment of males be a function of the abundance of spawning females. We've used that to model crabs where fisheries only retains males.
Relative Biomass Accumulation Rate (BA/B)
The BA/B term represents effect on the numbers at age of the population growth rate, (e.g., the cohort born one year ago should be smaller by the factor exp(-a BA/B) than the cohort born a years ago.
Wmaturity/Winf
Forcing Function Number for Hatchery Stocking
Multi-stanza populations can be designated as hatchery populations, and hatchery production can be varied over time in Ecosim using time forcing functions. To turn off natural reproduction select the hatchery forcing function from the pull-down menu in the Forcing function number for hatchery stocking box. For this, you must already have a forcing time series loaded in Ecosim. Forcing functions to represent historical changes in stocking rates can be entered via the same CSV files as used to set up historical fishing and model fitting scenarios. Enter stocking rates as values relative to the stocking rate of 1.0 assumed for the Ecopath base year.
At each simulation time step, the base recruitment for the population (calculated from Ecopath input parameters) will be multiplied by the current time value for the designated forcing function. If it is desired to simulate stocking of older fish (e.g., 18 months), the first stanza for the population should be set to have this duration, the mortality rate (Z or P/B) for the stanza should be set to 0.001, and the diet for the stanza should be set to 1.0 imported (i.e., no feeding in the modelled ecosystem).
Fixed Fecundity
Some types of organism (e.g., marine mammals or some sharks) may have a fixed number of young each year, regardless of adult bodyweight. Checking the Fixed fecundity check box fixes the number of recruits.
Biomass
You must enter estimated absolute biomass (in appropriate units) for one 'leading' stanza.
Z (Production/Biomass)
You must enter estimated total mortality rates for each stanza.
Consumption/Biomass
You must enter estimated consumption/biomass (Q/B) for one 'leading' stanza.
Habitat Area
This is the fraction of the total area in which the group occurs, that is, the fraction of the total area to which the biomass in habitat area pertains. Default is that the habitat area is 1, i.e. that the group occurs in the total area.
Biomass in Habitat Area
The average biomass per unit area in the habitat area where the group occurs. It is assumed that an average value can be used to represent the biomass of each group. Appropriate units should be used, (e.g., t km-2) for the biomasses. Entry of biomasses is optional for living groups, but biomass(es) should be entered for the detritus group(s). However, if biomasses are unknown for all living groups and there are no exports from any of the groups, it is necessary to enter at least one biomass estimate, preferably of a top predator. (But in such a hypothetical case: what is the purpose of that model?)
Biomasses should be entered relative to the habitat area where the group occurs. An example: assume a species for instance has a biomass of 1 t km-2 in its habitat area, and the habitat area is 100 km², while the total area in your model is 1000 km². You could then enter a habitat area of 0.1 and a biomass in habitat area of 1 t km-² as the biomass for the group in your model.
Biomass
This is the Biomass in habitat area x Habitat area.
Production/Biomass
Enter the Production/Biomass (P/B) ratio for each group using consistent units, e.g., per year. The P/B ratio is equivalent to the instantaneous rate of total mortality (Z) used in fisheries assessments [1](Allen 1971). Entry of P/B ratios is optional, but should as a rule be entered – don't leave it to estimation using the mass-balancing routine.
Production includes fishery yield (considered export in network analysis) plus predation plus net migration plus biomass change plus other mortality; or as expressed in the second Ecopath Master Equation,
[latex]P/B = Z = F + M2 + BA + E + M0\tag{1}[/latex]
Estimation of P/B is discussed in the EwE textbook
Consumption/Biomass
Consumption/biomass (Q/B) ratios are entered using the same units as for P/B. Entry of consumption/biomass ratios is optional, but it is strongly advised to enter P/B for all groups, not to let it be estimated by the mass-balance routine.
The Q/B input box will be blocked (blue colour) for primary producers. If your model unit is carbon, you can however, click the blue input box, and enter a Q/B value, which will be used to calculate respiration for the group.
Estimation of Q/B is discussed in the EwE textbook
Ecotrophic Efficiency
The ecotrophic efficiency (EE) is the fraction of the production that your model describe the fate of in the system, i.e. that is passed up the food web, used for biomass accumulation, migration or export (such as fished). Ecotrophic efficiency is difficult to measure directly. It varies between 0 and 1 and can be expected to approach 1 for groups with considerable predation pressure. The part of the production that is not included in the EE is often called ‘other mortality’. EE is dimensionless, and the entry of EE values is optional.
The ecotrophic efficiency of a detritus group is defined as the ratio between the flow out of a detritus box to the flow into the same box. EE for detritus cannot be entered, it is always calculated.
Other Mortality
Corresponds to 1-EE, if the other mortality is entered, EE will be blocked and vice versa.
Production/Consumption
The ratio between production (P) and consumption (Q) and is a dimensionless parameter. P/Q corresponds to what may be called the gross food conversion efficiency (g). This ratio is by default considered constant in Ecosim where Q is estimated and P deduced.
There are physiological constraints for the P/Q ratio, which in most cases will range from 0.05 to 0.3. Exceptions are top predators, e.g., marine mammals, which can have lower P/Q values, and small fast-growing fish larvae or nauplii or bacteria, which can have higher P/Q values (up to around 0.5). The value of the ratio is checked during the mass-balance routine, and warnings are given if production exceeds consumption (as can occur in organisms with symbiotic algae, such as corals and giant clams), or if the production exceeds half the consumption (which may be acceptable for bacteria, small nauplii and fish larvae, but usually not for other groups).
P/Q can only be entered if P/B and/or Q/B is left blank. If P/Q is entered along with, e.g., P/B, then Q/B will be calculated as Q/B = (P/B) / (P/Q).
Unassimilated Consumption
An estimate of the fraction of the food that is not assimilated must be entered if the currency of your model is energy-related. Following Winberg [2], a default value of 0.2 is suggested for carnivorous fish groups if other estimates are not available. Thus, 80% of the consumption is assumed to be physiologically useful while the non-assimilated food (consisting of faeces) is directed to the detritus. For herbivores, the proportion not assimilated may be considerably higher, e.g., up to 0.4 in zooplankton.
If the currency is a nutrient, there is no respiration, and the fraction of the food that is not assimilated is calculated as (1 - production / consumption). In this case, it is not possible to input the fraction of the food that is not assimilated.
The parameter for unassimilated food is dimensionless, it is entered as a proportion. A routine checks whether the sum of gross efficiency plus proportion of food not assimilated exceeds 1, and displays a warning if so. Then, a new and consistent proportion for the non-assimilated food must be entered.
Detritus Import
If there is import of detritus to the system, enter the quantity as a rate with a unit of, e.g., t km-2 year-1.
Diet Composition
In Ecopath predation links together the different groups in the model and diet composition must be entered for all consumer groups. While quantitative information on diet composition overall is sparse, there is a considerable amount of information in FishBase and SeaLifeBase. Unfortunately, much of the available information on diet compositions is expressed on a ‘percent occurrence’ basis or as ‘dominance’, both of which are of little use for quantification of diets, though there is a correlation with the preferable forms where diet inputs represent weight, volume or energy content of the preys [3].
At the Ecopath > Input > Diet composition form enter diet composition for all consumers, column by column (i.e., predators are represented by column and their prey by row). The diet compositions of each group should sum to 1. For guidance, the current sum of the fractions representing the food composition is summed at the second-but-last row (Sum). The last row (1 – Sum) shows the proportion of prey still to be entered. You can use the Sum to one button at the top of the Diet composition screen to raise a diet to unity. If diets do not sum to unity when you start basic estimation (i.e., try to balance the model) you will be given the option of having the software do the raising for you, or to return to the diet to do it yourself.
In Ecopath ‘import’ to a system is the consumption of preys that are not a part of the system as it is defined (for example for species that spend parts of the year feeding outside the area of the model, e.g., gulls feeding on fields during harvest time).
Note that import is different from migration Migration, which is a production term. Import is treated as a ‘prey’ in the diet composition, and should be entered as a fraction of the total diet. See the section on Dealing with open system problems in the chapter on Defining the ecosystem in the EwE textbook for more information on how to treat groups that feed both within and outside of the modelled area.
A warning about zero order cycles, i.e., groups that feed on themselves (‘cannibalism’). Avoid situations where the fraction of the food of a group taken from that same group exceeds ~0.1. This may occur when adults feed on their own juveniles. In such cases, it is advised to split the box into groups representing predator and prey stanzas, e.g., in adults and juveniles. This will not only reduce or eliminate a zero-order cycle, and the bothersome computational problems usually associated with such cycles, but also lead to groups with better-defined characteristics (because adults usually have much lower production and consumption rates than those of juveniles).
Detritus Fate
At the Ecopath > Input > Detritus fate form you must, f there is more than one detritus group in the system, specify where the detritus left over after the detritivores have covered their food intake is to be directed. Surplus detritus can be directed to the same detritus group (equivalent to ‘biomass accumulation’) or to other groups, by entering the appropriate fractions directed to each detritus groups. If these fractions sum to less than 1, the remaining part of the surplus detritus will be exported out of the system.
Other Production
Other production refers to production represented in Ecopath by migration and biomass accumulation. Migration is not the same as import – emigration and immigration are production factors, while import is food consumption.
If B, P/B, Q/B and EE are entered for a group, a prompt will appear during parameterization asking if you want to estimate biomass accumulation. If you answer no to this, a new prompt will ask if you want to estimate net migration. If you answer yes, the program will estimate net migration.
The net migration is calculated as emigration less immigration. This means that net migration will be negative if there is more coming into the system than leaving it. This may seem contradictory but it should be remembered that a negative mortality can yield an increase in population. If the net migration is positive (immigration > emigration), but not entered, the main effect will depend on the previous entries:
- if the production had been entered, the fraction of production directed toward the detritus will be overestimated; or
- if production was to be estimated, this estimate will be underestimated.
Immigration
Migration into the area covered by the model. Must be entered as a non-negative value. Unit is a flow, e.g., t km-² year-1.
Emigration
Migration out of the area. Must be entered as a non-negative value. Unit is a flow, e.g., t km-² year-1.
Emigration Rate
Emigration can also be presented as the proportion of the population emigrating from the system in a year (unit is year-1). The immigration rate can be entered by setting the emigration rate to a negative value.
Biomass Accumulation
Ecopath is not a steady-state model. If the biomass for a group is known, e.g., at the beginning of the year and at the beginning of the next year, the biomass accumulation (BA) can be calculated as the difference between these biomasses. BA is a production term that can be entered for all living groups (default is 0), but is calculated for detritus groups. BA is a flow term, with a rate unit of, e.g., t km-² year-1. The default value for BA is zero indicating no biomass accumulation. A negative value signifies biomass depletion (biomass decreased during period modelled).
If B, P/B, Q/B and EE are entered for a group, a prompt will ask during parameterization if you want to estimate BA. If you answer yes to this question the BA will be calculated, overruling any BA you may have entered.
If you have a BA is your Ecopath model, Ecosim and Ecospace will pick up these values and it will set both models on a trajectory when a model run starts. A negative BA value may for instance inform Ecosim that the fishing pressure in Ecopath is unsustainable and Ecosim will hence predict a decline over time in the species concerned.
Biomass accumulation rate
Biomass accumulation can also be represented as a rate relative to the total biomass, BA/B. The unit is (t km-2 year-1) / (t km-2) = year-1.
Fishery
At the Ecopath > Input > Fishery > Fleets > Define fleets... form you must first of all define your fishing fleets, then at the mother Ecopath > Input > Fishery > Fleets form set basic fleet cost parameters. Notice that the economic analysis that can be done with these basic cost factors is quite limited in comparison to what can be done with the full value chain analysis in EwE , see Ecopath > Output > Tools > Value chain.
Fixed Cost
Fixed cost is the cost of operating a fleet unit, independent of effort, in the unit time defined in Ecopath (typically on an annual basis). The definition of ‘fixed’ costs depends on the actual situation being modelled. To illustrate this consider some examples:
The Ecospace optimization module, Ecoseed, allows for effort reduction to nil in connection with simulated increase in protected areas from 0 to 100% of total model area. As the last boats operating in a fleet cannot cover the total ‘fixed’ costs of the total fleet; they should only bear the ‘fixed’ costs that are independent of effort. For this type of application use the ‘fixed costs’ only for costs that are independent of effort at the fleet scale, for instance for the costs of management and monitoring, (and subsidies if there are fixed subsidies to the fleet). Costs that are capacity dependent in this situation should beconsidered effort-related variable costs instead.
Effort can also be changed in Ecosim:
- If the changes are relatively small and intended to represent changes in effort with constant capacity, the fixed costs can beseen to represent all costs that are effort-independent at the boat- level. Examples are costs for management, monitoring, licenses, capitalization, and insurance.
- If the changes are major, the procedure outline for Ecoseed above should be adopted instead. Hence, consider the fixed costs to be effort-independent at the fleet level.
Effort Related Cost
Represents costs that are a function of effort. The examples above give some guidance to how these should be defined. Enter the costs as a percentage of the total value of the fishery in the given year. Simulation in Ecosim with changes in fishing effort are entered relative to the base effort, hence if the effort is increased with, e.g., 10% the variable costs are assumed to increase 10% as well, whereas the fixed costs are assumed unchanged.
Ecosim: use Effort related costs for all variable costs (e.g., fuel, gear costs and crew wages);
Ecospace: use Effort related costs for variable costs that depend on effort, e.g., for gear costs (which mainly depend on how many hours the gears is used), but not for costs that depend on spatial effort allocation, e.g., sailing costs. See next section.
Sailing Related Cost
For Ecospace applications it is recommended to use two separate forms for variable costs: effort-related and spatially-related (i.e., sailing related). Do not enter sailing related costs if you are only using Ecosim, then use effort related costs for all variable costs.
If you are using Ecospace, use Effort related costs for variable costs that depend on effort, e.g., for gear costs. Enter costs that depend directly on spatial effort allocation, e.g., fuel costs and crew wages as Sailing related costs.
Profit
Profit is calculated as percentage of value, calculated from total value less all costs. It cannot be entered directly.
Total value
The total value is the value of all landings (as entered on subsequent forms). It is displayed here only to indicate that the ‘100 %’ relates to value, not to total costs.
Landings
Landings and catches are not the same, as discarding is an integral part of most fishing operations. Ecopath calculates: Catch = landings + discards.
You should therefore enter only the landings here – while any discards should be entered on the discards form. Landings must be expressed as flows, typically in t km-² year-1. The area to be used should be the total area of your model, not just habitat area, or the area in which the fleet operates. For instance, if you are entering information for a coastal shrimp fishery, the landings (and discards) should be calculated relative to the total area of the model – even if most of it is too deep for trawling.
In a model of an ecosystem exploited by a fishery, the catch is the total extractions over the time period considered in the model, (e.g., a year), for each of the groups modelled. Similarly, in an aquaculture system the ‘catch’ is the harvest from each group over the time period considered, (e.g., a growing season considered representative for a year).
Fishery catches are normally based on landing statistics. This may cause a problem as official statistics are generally on a regional basis, not on an ecosystem basis. This can be of importance when defining the system to be modelled, either as a geographical/political region or as an ecosystem. It is necessary to consider the availability of appropriate catch data when taking such decisions. Sea Around Us data may be useful if you don't have access to local data or for comparison with local data.
The catches together with other export sum up to the total export. Catches are also used to estimate the fraction of primary production that is utilized in the system (i.e., the ‘gross efficiency of the fishery’).
Discards
Discarding is (or was) a normal practice in most fisheries, though this has changed with the EU Landing Obligation regulations. If you do not enter any information, you are assuming that discarding does not take place. If discarding does take place this is worse than guessing! Therefore, it is better to use information from similar fisheries in other areas or perhaps based on interviews with fishers in your area – or from the Sea Around Us .
Discarding may affect trophic and population dynamics. For example, in shrimp fisheries where the discards include predators on shrimps that may be turned into food for shrimps, an ecosystem model can be used to quantify the ecological role of discarding.
Discard Mortality
Discard mortality is a mortality rate in the [0,1] range, where by default the assumption is that all discards die.
Discard Fate
Ecopath needs to be told what to do with the discards you enter as part of the catches. Discards can either go to a detritus group or be exported. Discard fate is entered as a proportion, i.e., a value between and including 0 and 1, representing the fraction of the discards directed to a given detritus group (or exported).
If you are interested in quantifying the ecological impact of discarding it is recommended that you make a special detritus group called, e.g., ‘Discarded fish’ and direct the discards to this group.
Off-Vessel Price
Enter the market value (in the specified monetary unit per unit catch) for each group for each gear (fleet). It is generally not important whether the market values are entered in, e.g., €/kg or €/tonnes, as long as the entries are consistent among groups. This is, however, important for Value chain analysis, which are designed to quantify the total socio-economic benefits and costs of ecosystem usage.
The off-vessel prices are fleet-specific on the entry forms, as quality and hence price varies more between fleets than within fleets.
As per EwE version 6.7, negative off-vessel prices can be specified to impose quota penalties.
Non-Market Price
Shadow price or non-market price represents the value of a resource in the ecosystem, e.g., for non-exploitative uses. Values should be expressed in monetary units per unit biomass. At present it is assumed that there is a linear relationship between the biomass of a resource and its non-market price (if there is any). Hence, for groups with a non-market price it is assumed that a doubling in biomass will lead to a doubling of the resource’s non-market value.
Pedigree
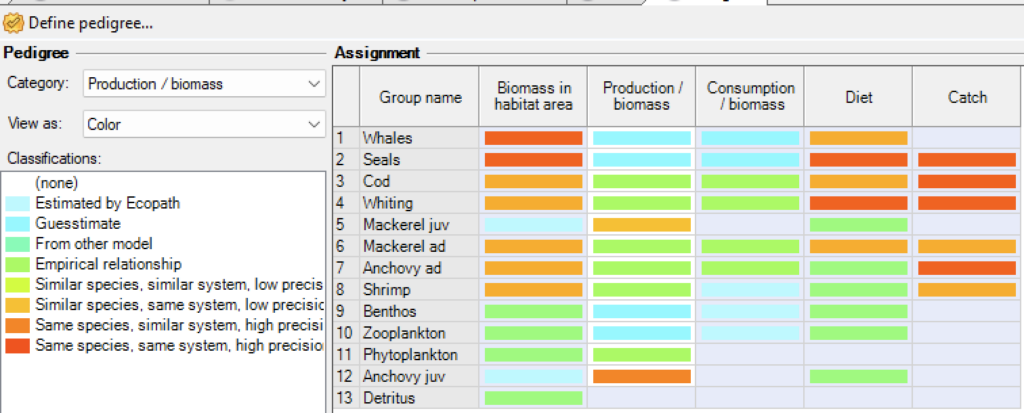
Figure 2 - Screenshot of pedigree table
Resources
There is a Quick guide on how to calculate P/B and Q/B for EwE models by Daniel Vilas, Marta Coll, Chiara Piroddi, Jeroen Steenbeek, developed for the EC Safenet Project, available at this link.
- Allen, K. R. 1971. Relation between production and biomass. J. Fish. Res. Board Can., 28:1573-1581. https://doi.org/10.1139/f71-23 ↵
- Winberg, G. G., 1956. Rate of metabolism and food requirements of fishes. In: Transl. Fish. Res. Board Can., Translation Series 194. pp. 1-253. https://waves-vagues.dfo-mpo.gc.ca/library-bibliotheque/38248.pdf ↵
- MacDonald, J. S., and Green, R. H. 1983. Redundancy of variables used to describe importance of prey species in fish diets. Can. J. Fish. Aquat. Sci., 40:635-637. https://doi.org/10.1139/f83-083 ↵
