Excluding Map Cells
Jeroen Steenbeek
Historically, one could only exclude Ecospace map cells from computations by changing such cells to be ‘land’. This would yield confusing maps with unrecognizable land contours. In response, the concept of excluded cells was introduced to the Ecospace model in EwE release 6.4. Excludes cells are defined as cells that do not contain ecosystem dynamics, that are not considered in the Ecospace computations, and that are not rendered in the map displays.
This feature allows accurate display of irregular (e.g., non-square) maps. During a recent project, the feature was used extensively but created confusion during model calibration and testing stages since it was sometimes not explicitly clear whether cells were empty due to misconfiguration of the model or due to excluded cells.
It was decided to add a feature that could be toggled to explicitly display which cells were excluded, and the following changes were made to the EwE software to satisfy this requirement in two aspects of the EwE source code:
- The EwE user interface has gained the means to toggle display of excluded cells in a few locations.
- When this option is turned on, the Ecospace input and output maps will always explictly indicate which map cells are excluded.
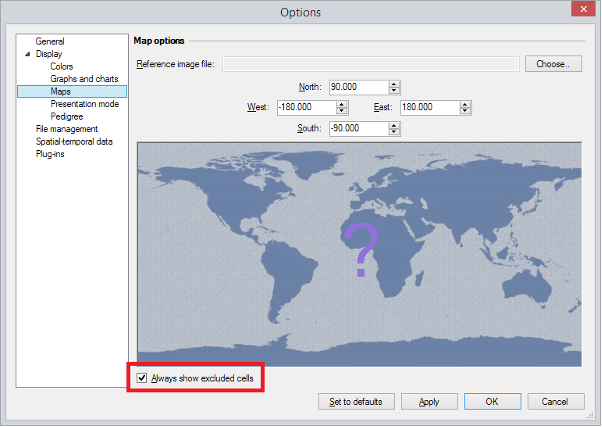
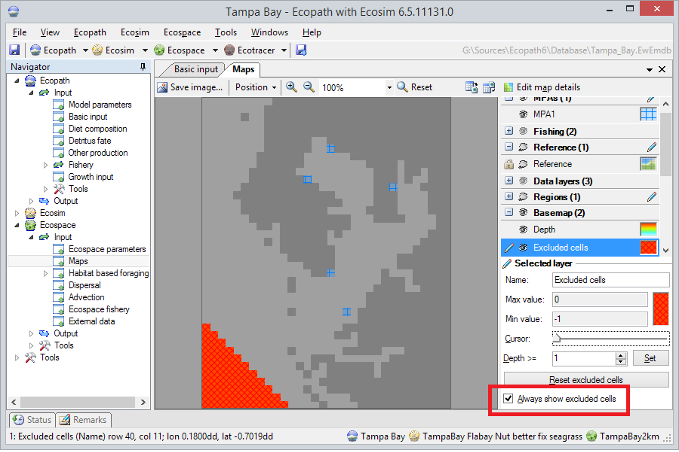
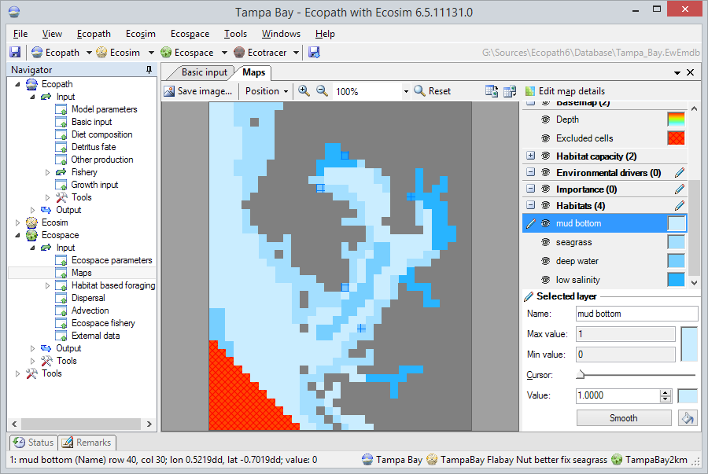
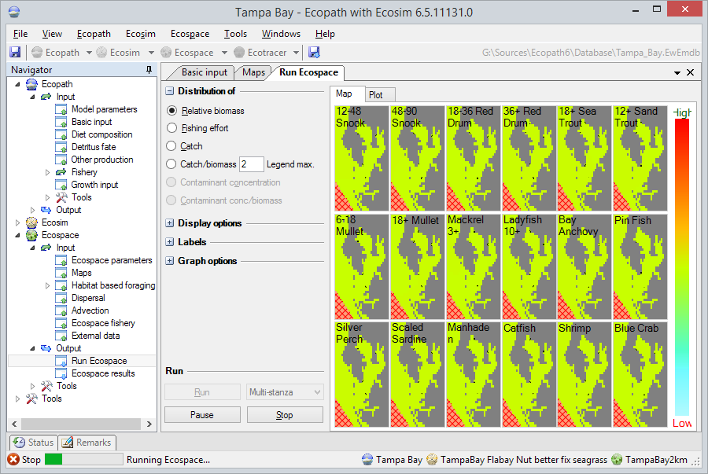
You can toggle the Always show excluded cells flag in the Maps form of the EwE options interface, found in the main menu (Figure 1), as well as in the excluded cell editor in the Ecospace input maps interface (Figure 2). The Ecospace input and output maps provide correct visual feedback (Figure 3 and Figure 4).