Other Mortality Response Functions
David Chagaris; Joe Buszowski; and Jeroen Steenbeek
Scope and Purpose
This document provides usage instructions for the other mortality response function in the Ecopath with Ecosim food web modelling approach.
Summary
Aquatic ecosystems are often exposed to mass mortality events that can be caused by a variety of factors such as low dissolved oxygen, harmful algal blooms, extreme heat/cold events, contaminants, or noise pollution. The EwE software includes the ability link environmental drivers to the ‘other mortality’ (M0) component (non fishing or predation) to simulate direct lethal effects of environmental stressors. The MO response function can be used in combination with the habitat capacity model to capture both lethal and sublethal (feeding and movement) effects in the model. An example application to red tide on the West Florida Shelf is provided in publication by Vilas [1] and Vilas et al. [2] [3].
Computations
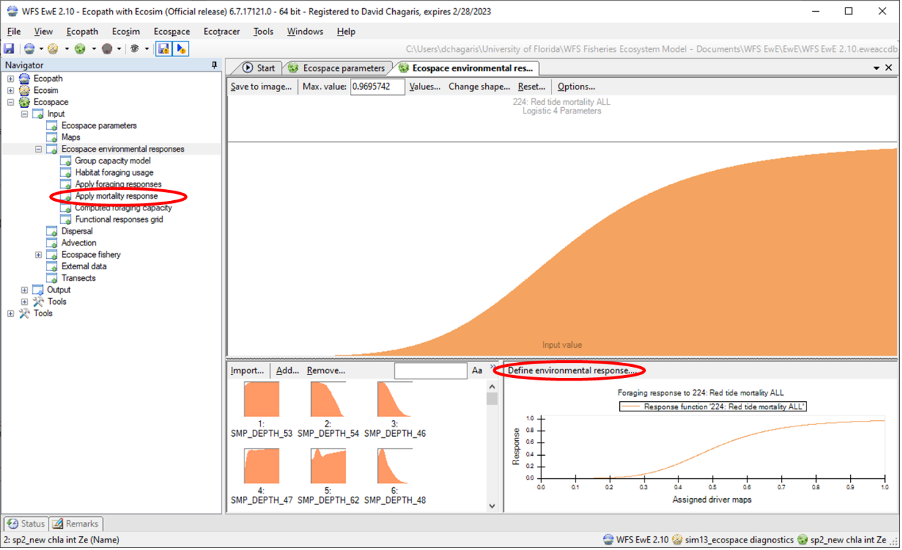
The amount of other mortality that is to be added to the baseline M0 is determined by a user defined environment response function and input environment forcing time series (if in Ecosim) or driver maps (in Ecospace). The forcing data must be continuous in nature, representing the concentration or intensity of the mortality agent. The M0 response function can take any shape, but must be constrained between 0 and 1 across all values of the mortality driver. An example of the useful logistic response function is given in Figure 1.
The proportion of the total biomass that will experience mortality in a given time step and grid cell is given as [latex]P_{mort} = f(x)[/latex], where x is the value of the mortality forcing function at the time step and grid cell and Pmort is calculated from the response curve at the value of x. The proportion killed is converted to an annual instantaneous rate, [latex]\hat{P}_{mort}[/latex], to match Ecopath M0 units (1). The rate is then converted to a multiplier (M0mult) on the baseline M0 rate (M0base).
[latex]\hat{P}_{mort} = - \ln(1-P_{mort} \cdot 12) \tag{1}\label{1}[/latex]
[latex]M0_{mult}=(\hat{P}_{mort}+M0_{base}/M0_{base} \tag{2}\label{2}[/latex]
In Ecosim and Ecospace, the M0 multiplier is included in the loss equation (3) at each time step and grid cell as,
[latex]loss_i=Q_i + (M0_{base_i} \cdot M0_{mult_i} \cdot(1 - M0_{pred_i} \cdot F_{time_i}) +E_i + F_i) \cdot B_i \tag{3}\label{3}[/latex]
Where Q is the total consumption of group i by all predators, Ftime is the fraction of other mortality sensitive to changes in feeding time, M0pred is the effect of predators on feeding time, E is the emigration rate, F is the fishing mortality rate, and B is biomass.
Configuring M0 Environmental Response Functions
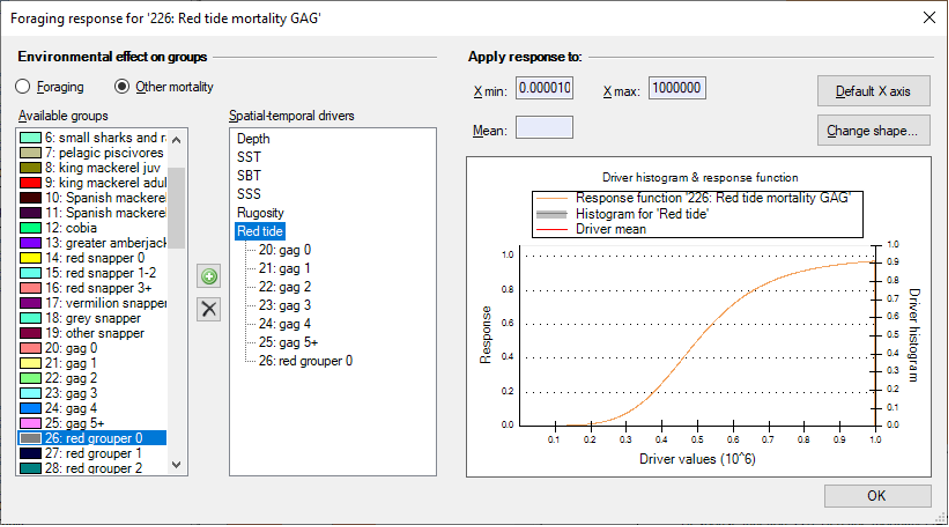
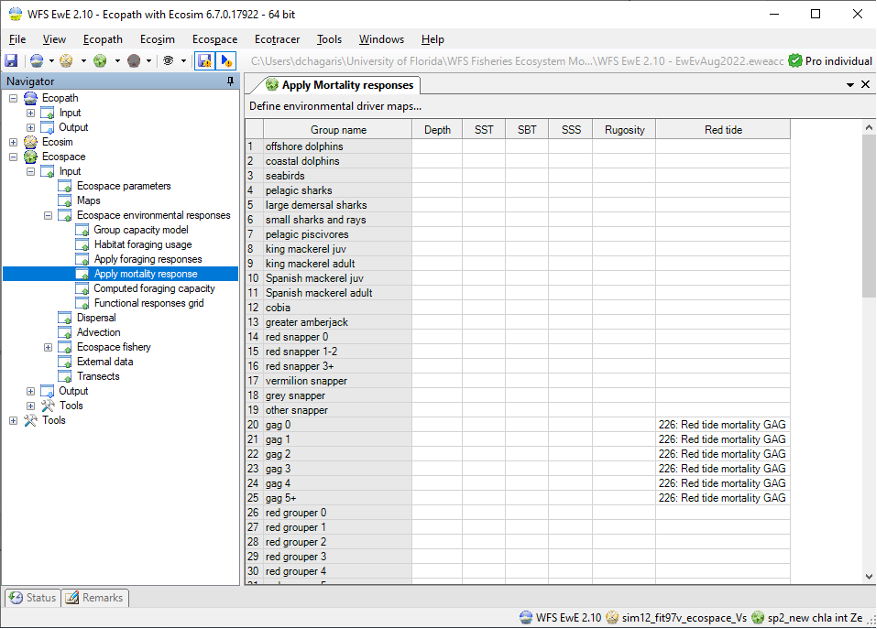
First, the mortality agent must be loaded as a forcing function time series (in Ecosim) or as an environmental driver in Ecospace linked to external data. Next, create a new response function using the Ecospace > Input > Environmental Responses interface (Figure 1). From there, select the Define environmental response… button to open a new window, select the Other mortality radial button, then click on the mortality agent under the list of Spatial-temporal drivers, select a species or functional group, and click the plus button to apply the mortality response (Figure 2). Alternatively, one may go to the Apply mortality response under the Environmental Responses menus (Figures 1 and 3) to associate a functional groups with a mortality curve. The total calculate loss due to other mortality forcing is saved as time series, summed over all grid cells by Ecospace region, or as ascii maps for biomass loss in each grid cell. These output options must be selected in the Ecospace parameters save settings.
Acknowledgements
Other mortality forcing was implemented by Joe Buszowski and Jeroen Steenbeek after an idea by David Chagaris, with input from Carl Walters and Villy Christensen. The work is a result of research funded by the National Oceanic and Atmospheric Administration's RESTORE Science Program under award NA17NOS4510098 to the University of Florida.
- Vilas Gonzalez, Daniel. 2022. Spatiotemporal Ecosystem Dynamics on the West Florida Shelf : Prediction, Validation, and Application to Red Tides and Stock Assessment. PhD Dissertation, University of Florida, 2022. Available online: https://ufdc.ufl.edu/ufe0058578/00001 ↵
- Vilas, Daniel, David Chagaris, and Joe Buszowski. 2020. Red tide mortality on gag grouper from 2002-2018 generated by an Ecospace model of the West Florida Shelf. SEDAR72-WP-01. SEDAR, North Charleston, SC. 17 pp. Available online: https://sedarweb.org/documents/sedar-72-wp-01-red-tide-mortality-on-gag-grouper-from-2002-2018-generated-by-an-ecospace-model-of-the-west-florida-shelf/. ↵
- Vilas, D., Buszowski, J., Sagarese, S., Steenbeek, J., Siders, Z., Chagaris, D., 2023. Evaluating red tide effects on the West Florida Shelf using a spatiotemporal ecosystem modeling framework. Scientific Reports 13, 2541. https://doi.org/10.1038/s41598-023-29327-z ↵
