Results Extractor
Introduction
The Results Extractor was developed in response to the need users have, to easily retrieve data and parameter values from within EwE6. This chapter will explain how to use the Results Extractor to do this.
In most cases the language used for titles of options is explained in this EwE User Guide. Only where the language and functionality is new will an explanation be given here.
Starting the Results Extractor
The Results Extractor can only be started after Ecosim has been run. After Ecosim has been run, it can be started by selecting Menu > Tools > Results Extractor. After the Results Extractor has been started, you will be presented with a window of checkboxes.
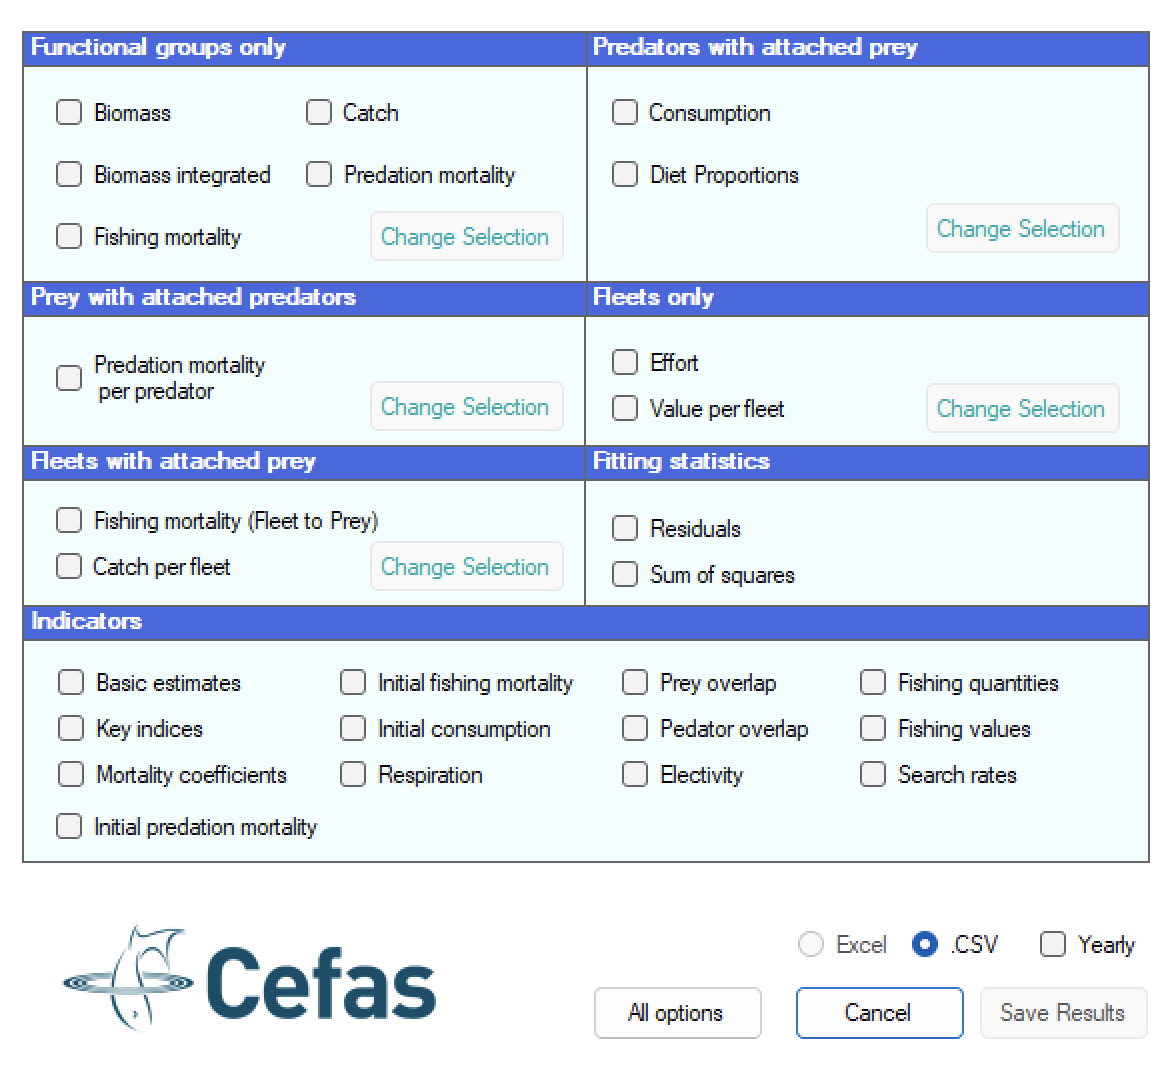
Simply check all boxes for the data and parameter values that you would like to retrieve from within EwE.
Selection Windows
For some checkboxes a selection window will be opened. Figure 2 shows the selection window that opens when you click on Biomass.
These selection windows are how you select which functional groups and fleets you want the data and parameter values for. Simply double click on a group or use the arrows at the bottom to move the groups you want output for.
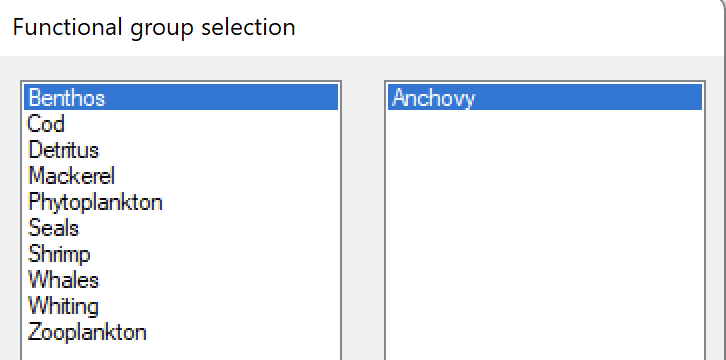
Some selection windows have three columns like this window that opens when you click on Consumption as you need to select both predators and prey. So, when you are getting output for Consumption, you first select which predators you are interested, and then for each predator you have selected, you select which prey you want consumption values for.
Option Groupings
The checkboxes have been visually grouped together in a box. An example is the Functional groups only top left section in Figure 1. When the checkboxes that are grouped together in a box that has a Change Selection button, it means that whatever selection is made in the selection window, will apply to all other checked options within that group. Selections can also be modified for that group by clicking on the Change Selection button to re-open the selection window.
Biomass Integrated Checkbox
Biomass integrated has been introduced as a quantity that can be used to compare two different management strategies. It works by subtracting the initial biomass from the biomass at each time step to give the change from initial biomass. The area under the time series for change from initial biomass is then calculated.
This is helpful because it indicates not just what the difference is between the initial and final biomass but also incorporates what the biomass has been throughout the time series. The benefit of this can best be seen by imagining two different biomass time series, A and B, each being the result of a different management strategy. Each time series starts and finishes at the same point, but time series A spends most of the time above the initial biomass, whilst time series B spends most of the time below the initial biomass. If we just compared the two management strategies by comparing the final biomass values or initial/final biomass the indicator calculated would suggest no preference between the two strategies, whilst the integrated method would suggest that strategy A would be the preferable strategy as it leads to a higher biomass on average over the time period.
Consumption
The Consumption option retrieves the values required to calculate the rate of consumption of a predator on a prey and outputs the calculated result. Consumption is given as an absolute rate of consumption not a relative rate of consumption. The equation used for calculation is,
[latex]Q_{ji} = B_j \ (Q/B)_j \ DC_{ji} \tag{1}[/latex]
Where Qji is consumption rate of predator j on prey i, Bj the biomass of predator j, (Q/B)j is the consumption/biomass ratio for predator j, and DCji is the percentage of predator j’s diet that is prey i.
Fitting Statistics
The first option is the residual option. As the name suggests this produces output for the time series of residuals for each functional group. This can be helpful in identifying where in a time series the model differs most from the data.
The second option is the SS or sum of squares option. This gives output of the sum of squares for all function groups as well as an overall SS value for the whole model.
Yearly
When you select this option the Results Extractor will calculate and output the values for each year rather than each month for all time series outputs. This is done by calculating the mean over the year.
All Options
You can click on this option if you want the Results Extractor to retrieve everything (i.e. tick all boxes). After you have clicked on it, you will be taken through all the selection windows required to select all options. When this process is complete, all options will be checked.
References
The Results Extractor was developed by CEFAS
