Statistical Geography
Statistical Geography
(compiled from wikipedia)
Statistical geography is the study and practice of collecting, analyzing and presenting data that has a geographic or area dimension, such as census or demographics data. It uses techniques from spatial analysis, but also encompasses geographical activities such as the defining and naming of geographical regions for statistical purposes. For example, for the purposes of statistical geography, the Australian Bureau of Statistics uses the Australian Standard Geographical Classification, a hierarchical regionalization that divides Australia up into states and territories, then statistical divisions, statistical subdivisions, statistical local areas and, finally, census collection districts.
Geographers study how and why elements differ from place to place, as well as how spatial patterns change through time. Geographers begin with the question “Where?” to explore how features are distributed on a physical or cultural landscape, observing spatial patterns and the variation of phenomena. Contemporary geographical analysis has shifted to “Why?” to determine why a specific spatial pattern exists, what spatial or ecological processes may have affected a pattern, and why such processes operate. Only by approaching the “why” questions can social scientists begin to appreciate the mechanisms of change, which are infinite in their complexity.
Spatial Data and Descriptive Statistics
There are several potential difficulties associated with the analysis of spatial data. Among these are boundary delineation, modifiable areal units, and the level of spatial aggregation or scale. In each of these cases, the absolute descriptive statistics of an area (the mean, median, mode, standard deviation, and variation) are changed through the manipulation of these spatial problems.
Boundary Delineation
The location of a study area boundary and the positioning of internal boundaries affect various descriptive statistics. With respect to measures such as the mean or standard deviation, the study area size alone may have large implications. Consider a study of per capita income within a city: if confined to the inner city, income levels are likely to be lower because of a less affluent population, but if expanded to include the suburbs or surrounding communities, income levels will become greater with the influence of homeowner populations. Because of this problem, absolute descriptive statistics such as the mean, standard deviation and variance should be evaluated comparatively only in relation to a particular study area. In the determination of internal boundaries this is also true, as these statistics may only have valid interpretations for the area and subarea configuration over which they are calculated.
Spatial Aggregation/Scale Problem
Socio-economic data may be available at a variety of scales, such as municipalities, regional districts, census tracts, enumeration districts or at the provincial level. When these data are aggregated at different scales, the resulting descriptive statistics may exhibit variations, either in a systematic, predictable way, or in a more uncertain fashion.
Descriptive Spatial Statistics
For summarizing point pattern analysis, a set of descriptive spatial statistics has been developed that are areal equivalents to nonspatial measures. Since geographers are particularly concerned with the analysis of locational data, these descriptive spatial statistics (geostatistics) are often applied to summarize point patterns and to describe the degree of spatial variability of some phenomena.
Spatial Measures of Central Tendency
An example is the idea of a centre of population, of which a particular example is the mean centre of the BC population. Several different ways of defining a centre are available:
- Mean centre: The mean is an important measure of central tendency, which when extended to a set of points, located on a Cartesian coordinate system, the average location, centroid or mean centre, can be determined.
- The weighted mean centre is analogous to frequencies in the calculation of grouped statistics, such as the weighted mean. A point may represent a retail outlet, while its frequency will represent the volume of sales within the particular store.
- The median centre or Euclidean centre and in the median centre of BC population.
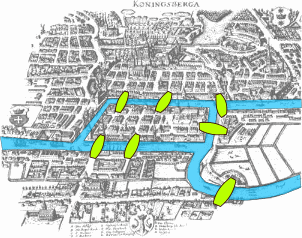
Topology
The motivating insight behind topology is that some geometric problems depend not on the exact shape of the objects involved, but rather on the way they are connected. One of the first papers in topology was the demonstration, by Leonhard Euler, that it was impossible to find a route through the town of Königsberg (now Kaliningrad) that would cross each of its seven bridges exactly once. This result did not depend on the lengths of the bridges or on their distance from one another, but only on connectivity properties: which bridges are connected to which islands or riverbanks. Known as the Seven Bridges of Königsberg, this is now a famous problem in introductory mathematics, and it led to the branch of mathematics known as graph theory.
Topology rules are particularly important within GIS, and are used for a variety of correction and analytical procedures. The primary shapes in GIS are the point, line and polygon, each of which implies different spatial characteristics; for instance, the only shape that has a distinguishable inside and outside is the polygon. Principles of connectivity associated with topology lead to applications in hydrology, urban planning, logistics and other fields. Topological analyses offer unique modelling capabilities, defining the vector nature of topological features and correcting spatial data errors from digitizing.
Parts of this text have been modified from http://en.wikipedia.org/wiki/Statistical_geography
Statistics.
Further readings and additional activities.
Suggested textbooks.
Understanding Basic Statistics. 2012. Brase. C. H. and Brase. C. P. Brooks Cole.
Basic Statistics: An Introduction with R. 2012. R. Tenko. Marcoulides G. A. Rowman & Littlefield Publishers.
Lectures of compete statistics course.
https://www.youtube.com/watch?v=CWrgEjXGzfg&list=PL02A86BB93BE23D65&index=1
Source: coursera.org (https://www.youtube.com/watch?v=CWrgEjXGzfg&list=PL02A86BB93BE23D65&index=1)
