Chapter VI: Solution Purification by Solvent Extraction (SX)
4. Engineering and Operating SX Circuits
The McCabe-Thiele Construction
The basic tool for engineering an SX circuit is the McCabe-Thiele diagram. A McCabe-Thiele diagram can be used to determine the flow rates of the various process streams (the PLS flow rate is set by consideration of other factors as well, such as ore grade, PLS grade, total known ore tonnage and target production rates.) The changes in concentrations of the streams are also determined by this analysis. First we need some key pieces of data:
- PLS flow rate.
- PLS copper concentration.
- An estimate of the target extent of extraction of copper from the PLS; typically 90-95% in practice. (These three data will set the copper metal production rate.)
- The organic reagent to be used.
- The reagent concentration.
- The extraction isotherm.
- Copper concentration in the spent electrolyte.
- H2SO4 concentration in the spent electrolyte.
- Copper concentration in the rich electrolyte.
- The stripping isotherm.
There is a strong interplay between many of these factors. For example, the copper concentration in the rich electrolyte determines the barren organic copper concentration (as will be shown). This in turn influences the extraction of copper from the PLS. The approach to designing an SX plant is more a back-and-forth iterative one than a step-by-step series.
Next, there are a few important principles to bear in mind:
- The McCabe-Thiele analysis is based on the mass balance concept.
- In the basic SX case the aqueous and organic streams flow in countercurrent fashion.
- SX and EW are treated as operating at steady state. Ideally this is what we want in practice. At steady state mass in = mass out.
- The combination of stream flow rates and equilibrium lines is used to do the analysis.
Consider the schematic diagram for an n-stage extraction circuit (loading only) in Figure 4.1. Each stage here represents a discrete, separate operation where aqueous and organic are mixed and then allowed to separate. In practice these are called mixer-settlers. Stripped organic solution returns from stripping with a residual copper concentration yn+1, at a flow rate O m3/h and enters stage En. Aqueous PLS from leaching enters stage E1 at a flow rate A and with a copper concentration x0.
The aqueous solution flows countercurrent to the organic solution. This has been the traditional means of contacting aqueous and organic solutions since the start of copper SX practice. The stripped organic has the highest [RH], or greatest extraction capacity (it still contains residual Cu+2; stripping is not complete). It enters the final stage and contacts the most copper-depleted, lowest-pH aqueous solution. The relatively high [RH] favours additional transfer of copper into the organic phase (based on Le Chatelier’s principle and reaction 2). In the first stage the organic is now partially loaded and [RH] has decreased. But, the PLS has the highest copper concentration and the highest pH in the circuit and so again, further transfer of copper into the organic phase is promoted. This explanation provides a rationale for why the countercurrent principle has been applied in copper SX for so long (as in so many other aspects of hydrometallurgy as well).
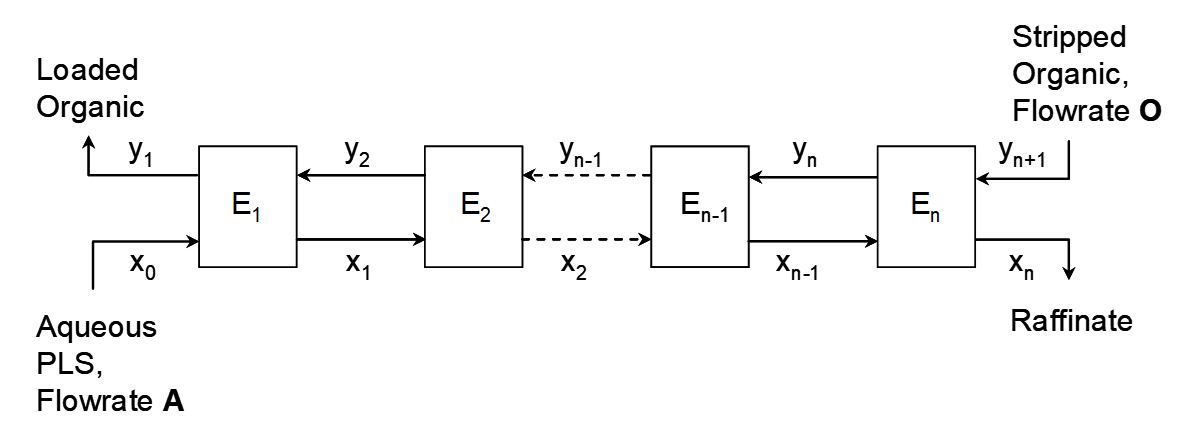
Mass balance equations can be written for any stage, or number of stages or the whole process; see equations [15-17]. In each stage after contact of the phases new copper concentrations are attained in each phase. These are indicated in Figure 4.1 on the streams exiting each stage. It is common to designate the copper concentrations for the PLS, raffinate, barren organic and loaded organic as indicated below:
PLS (feed): x0
Raffinate: xn (for n stages)
Barren organic: yn+1, (for n stages)
Loaded organic: y1
For any given stage, i, the copper concentration in the aqueous phase in that stage, at steady state, is xi. The concentration in the stream entering stage i is xi-1, and it leaves at concentration xi. In the limit of long enough time the steady state will be the equilibrium state. For this analysis we will assume equilibrium is attained. In practice equilibrium may not be quite attained, though a steady state is. Increased residence time needed to attain equilibrium means larger equipment. In Cu SX usually this is not worthwhile. In extraction the steady state [Cu+2]org usually attains to 85-90% of the equilibrium value. The copper concentration in the aqueous drops from one stage to the next, while the copper concentration in the organic rises (as copper is extracted) from one stage to the next. For stage i the organic copper concentration entering is yi+1 and it leaves at yi. This means that the aqueous copper concentration in stage i steps down by Δxi = xi-1 - xi. Similarly, the copper concentration in the organic steps up by Δyi = yi - yi+1. The total change over all n stages is the sum of the individual changes for each stage. The mass transferred from the aqueous phase must equal the mass transferred into the organic phase (steady state implies mass balance) and is calculated by the product of the flow rate (e.g. m3/h) times the concentration change (e.g. kg/m3):
\[\ce{A\,\Delta x_i = O\,\Delta v_i} \tag{12}\]
\[\ce{\Delta v_i = \left(\frac{A}{O}\right)\Delta x_i} \tag{13}\]
This is the basis for understanding and using the McCabe-Thiele construction. Over all n stages the total change in organic [Cu+2] is:
\[\ce{\Delta y = \left(\frac{A}{O}\right)\Delta x} \tag{14}\]
where Δy is y1 - yn+1 and Δx = x0 - xn.
(The same considerations can be applied to stripping.)
Consider the mass balance equations for two stages of extraction as shown in (Figure 4.2).

For stage 2:
\[\ce{y_2 - y_3 = \frac{A}{O}(x_1 - x_2)} \tag{15}\]
For stage 1:
\[\ce{y_1 - y_2 = \frac{A}{O}(x_0 - x_1)} \tag{16}\]
Overall:
\[\ce{y_1 - y_3 = \frac{A}{O}(x_0 - x_2)} \tag{17}\]
From equation [15] we can see that the x1, y2 and x2, y3 are points on a straight line with a slope of A/O. Likewise from equation [16], the points x0,y1 and x1,y2 are points on a straight line with the same slope of A/O. Thirdly, the two lines have the point x1, y2 in common, so all three are on the same straight line. This is illustrated in Figure 4.3.
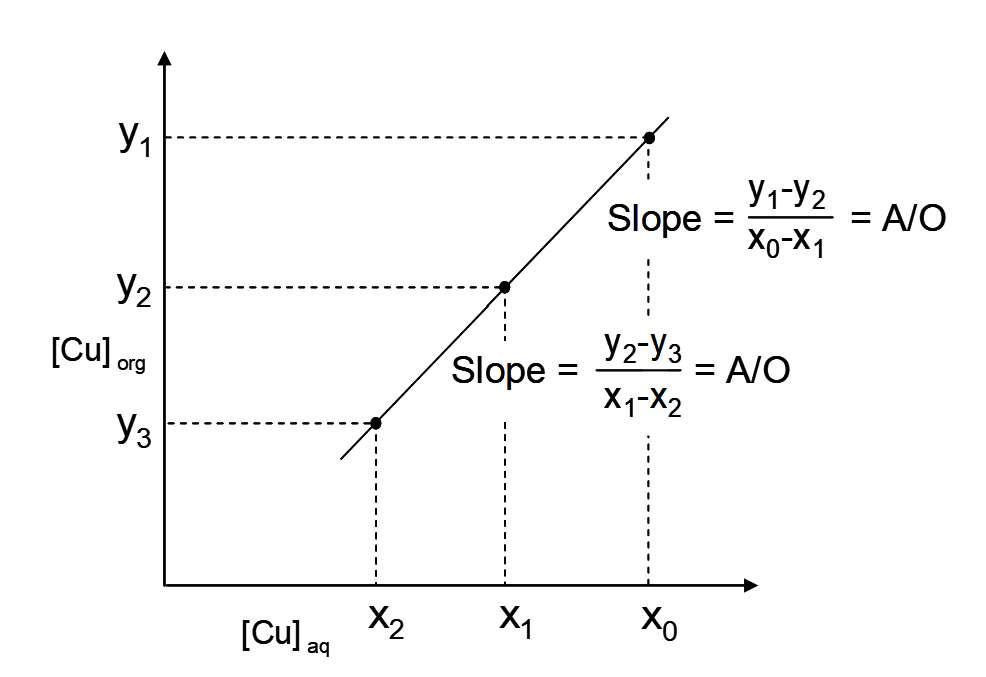
This frequently confuses students. It does not seem logical that the slope of that line should be A/O when the plot is for [Cu] organic versus [Cu] aqueous. But, this is simply how it turns out when the mass balance equations are considered.
For each stage Δyi/Δxi = A/O and over all n stages the Δy/Δx = A/O, where Δy and Δx are the overall concentration changes. So then, what do we need the loading isotherm for? The combination of the isotherm and the A/O line determines the concentrations in each stage, i.e. the xi and the yi. This then allows us to plot a McCabe-Thiele diagram.
The equilibrium loading curve (isotherm) is an upper bound. Every point xi, yi on this line is an equilibrium [Cu+2]aq, [Cu+2]org condition. Every point (aqueous and organic compositions) below this line is a disequilibrium condition and by chemical reaction, the compositions in the aqueous and organic will change towards equilibrium. The phase ratio (A/O) is another limiting condition. It dictates that for any change in aqueous concentration, Δx, the corresponding change in organic concentration, Δy, MUST be (A/O)Δx, based on mass balance.
The equilibrium isotherm or extraction curve is plotted. An A/O ratio is chosen. For example, one may know the concentration of copper in the PLS, a target concentration in the raffinate and the likely concentration in the barren organic, as determined by the stripping operation (more on how to do this later). Note then that based on equation (Spence & Soderstrom) we can vary y1 (i.e. achieve different levels of organic loading) by varying the A/O ratio. Since in practice A is set by the PLS flow, it is O that we can vary in SX, in order to change A/O. (The A/O line is also known as the operating line.) The following illustration (Figure 4.4) is a McCabe-Thiele diagram for two stages of extraction:
![Equilibrium curve for copper solvent extraction showing organic [Cu] versus aqueous [Cu], with labeled points (x₀, y₁), (x₁, y₂), and (x₂, y₃) marking two extraction stages. Arrows trace copper transfer from aqueous PLS at x₀ to raffinate at x₂, and from loaded organic at y₁ to barren organic at y₃.](https://pressbooks.bccampus.ca/hydrometallurgy/wp-content/uploads/sites/1991/2026/02/Ch6_F13_Copper_Extraction_McCabe_Thiele.png)
Note that by raising or lowering the A/O ratio (slope) we can increase or decrease y1, respectively. The horizontal arrows indicate the changes in aqueous copper concentrations, and the vertical ones the organic copper concentration changes. With each stage we step down in aqueous copper and step up in organic copper content. The extents of these changes depend on the isotherm shape and where the A/O line lies. (The "location" of the operating line depends on the xi, yi+1 points on the line. For instance, if we specify the raffinate and barren organic concentrations and the A/O value, then the line is determined.)
The PLS aqueous enters stage 1 at x0 g/L Cu. Its concentration drops to x1 while that of the organic rises. At the same time the organic enters from stage 2. Its change in concentration is:
\[\ce{\Delta y_1 = y_1 - y_2 = \frac{A}{O}\Delta x_1 = \frac{A}{O}(x_0 - x_1)} \tag{18}\]
as per equation [16]. The equilibrium concentration is indicated by the point on the equilibrium line, x1, y1. The mixture of the two incoming streams in each stage is a disequilibrium situation. For stage 1 the organic enters with a concentration y2 and the aqueous enters at a concentration x0. (This “point” is not shown on the conventional McCabe-Thiele diagram. If it was the diagram would look like Figure 4.5. Usually we don’t draw McCabe-Thiele constructions this way though.) The disequilibrium situation moves towards equilibrium (dictated by the isotherm and the constraint that Δy = (A/O)Δx), i.e. towards a composition x1, y1. The loaded organic (concentration y1) leaves the extraction circuit and proceeds to stripping.
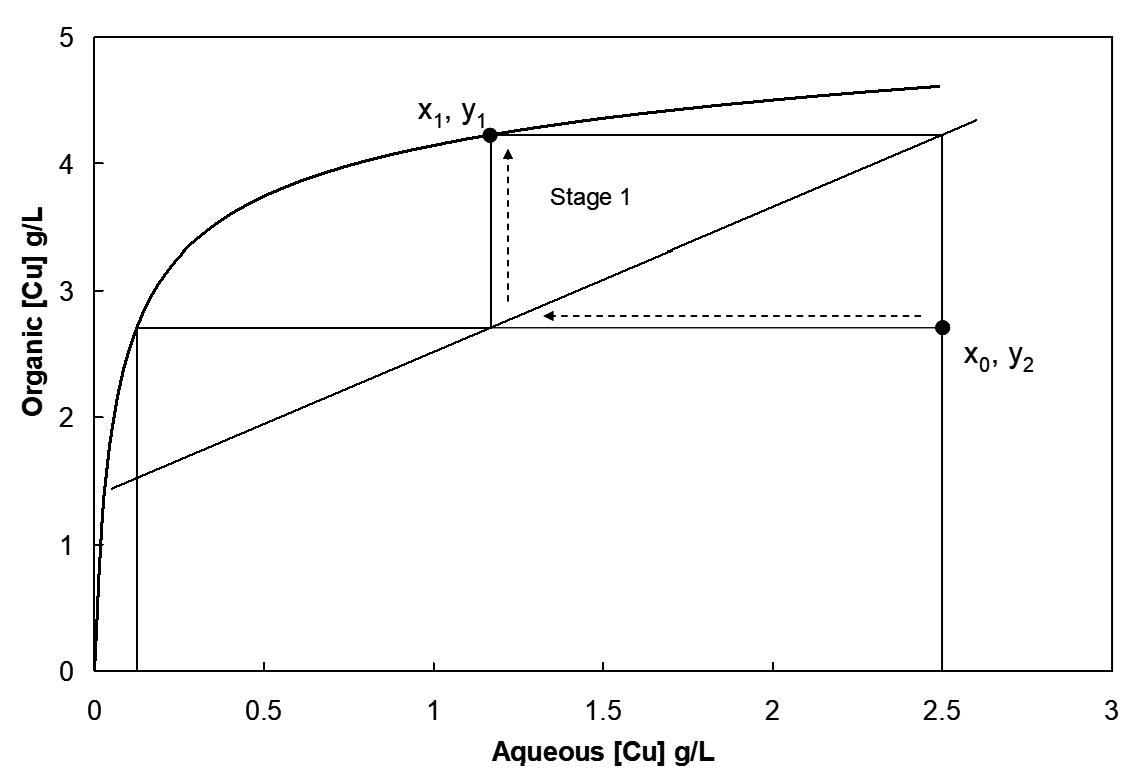
Similarly barren organic enters stage 2 at concentration y3 and leaves at the increased concentration y2, where it intersects the equilibrium line. At the same time aqueous from stage 1 enters stage 2 and is further depleted of copper from x1 to x2, the raffinate concentration.
Of course with a different operating line and more stages one could in principle achieve better extraction (lower raffinate and higher loaded organic concentrations). The number of stages chosen and the organic flow rate for a particular process depends on the shape of the equilibrium curve and the overall economics. The barren organic copper concentration represents an inventory cost of organic reagent that is not utilized. (A steady concentration of copper persists in the organic equal to the barren organic copper concentration; not all the copper is stripped.) Residual copper concentrations in the raffinate and barren organic are inventory copper costs.
In conventional copper SX usually 2 or 3 stages of extraction are used. Where greater extraction is desired to lower copper inventory costs 3 stages of extraction may be used. Obviously stripping will be more effective if more stages are used as well. The tradeoff is that more stages increase capital cost (equipment, buildings and initial reagent volume) as well as operating costs. The number of extraction stages is commonly designated nE where n = 2-3; the number of stripping stages is designated mS where m = 1-2. Thus 3E 2S staging means 3 extraction stages followed by 2 stripping stages. The 2E 1S configuration is quite common in copper SX.
There are several factors that influence the shape of the extraction equilibrium line (loading curve):
- The PLS composition (e.g., [Cu+2], pH, [Fe+3], total sulfate)
- The SX reagent
- The diluent (solvent; e.g. aromatic and aliphatic content)
- Added modifier
- SX reagent concentration
- Temperature (has a modest effect for most operations)
A steeply rising curve as in Figure 4.4 requires fewer stages to achieve significant recovery. A more gradually rising curve might require more stages (e.g. if the PLS pH is low).
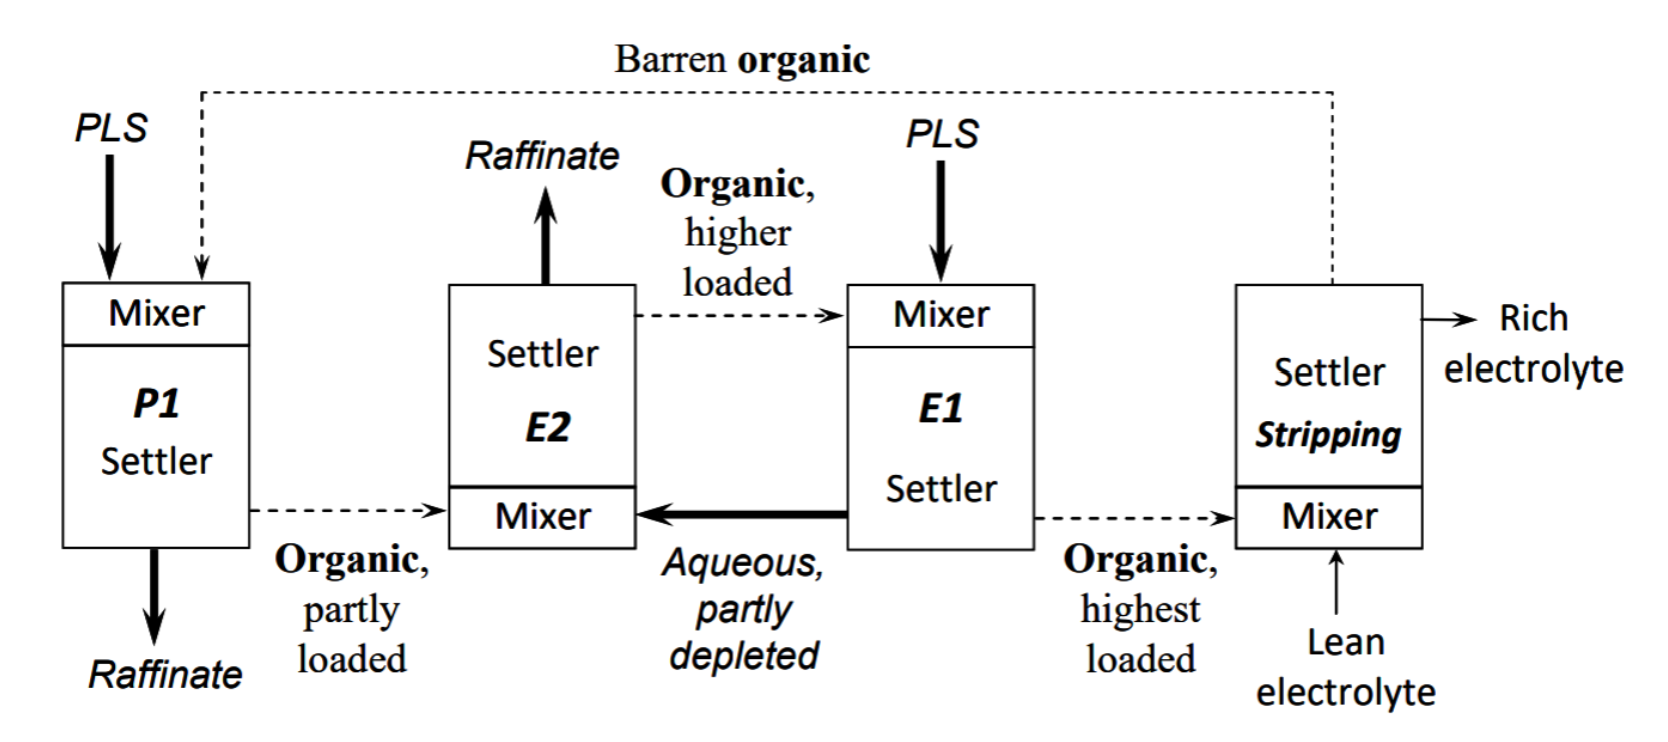
Stripping is the exact opposite of extraction (the reverse of reaction 2). The loaded organic now is back-extracted or stripped to transfer copper into a new aqueous phase; the electrolyte. The aqueous phase is called an electrolyte because it is a concentrated solution and it is used for electrolysis. A schematic illustration of a single stripping stage (1S) with flows and concentrations is provided in Figure 4.5. Note that the organic flow rate, O, is the same as in extraction (see Figure 3.6).
The high concentration of H2SO4 in the spent electrolyte exiting electrowinning ensures that the stripping curve is quite steep. An example for 8% Lix 984N is shown in Figure 4.6 along with the corresponding McCabe-Thiele construction. The loaded organic enters stripping at a concentration of y1 and leaves (as barren organic) at a concentration y3, as defined for loading. The lean electrolyte enters at concentration z2 and leaves as rich electrolyte at z1. Note again that the entering streams present a disequilibrium situation and that in stripping the concentrations move towards equilibrium (with copper now transferring from the loaded organic to the electrolyte). The equilibrium composition is y3,z1. The stripped organic goes back to extraction and the rich electrolyte goes back to EW. A schematic diagram showing the overall SX process is shown in Figure 4.7.
![Equilibrium graph for copper solvent extraction with organic [Cu] (0–4.5 g/L) on the x-axis and electrolyte [Cu] (0–45 g/L) on the y-axis. Includes an O/A operating line, points (y₁, z₁), (y₃, z₁), and (y₃, z₂), plus labeled regions for lean and rich electrolyte, barren organic, and loaded organic.](https://pressbooks.bccampus.ca/hydrometallurgy/wp-content/uploads/sites/1991/2026/02/Ch6_F16_Single_Stage_McCabe_Thiele.png)
Copper Extraction Per stage and Overall Extraction
The percentage extraction is define as the ratio of what is transferred to the aqueous phase over what came in with the aqueous phase, or what was removed over what was put in. For any one stage the % extraction is:
\[\ce{\%\,\text{extraction}
= \frac{O\,\Delta x_i}{A\,x_{i-1}} \times 100
= \frac{A\,\Delta x_i}{A\,x_{i-1}} \times 100
= \frac{\Delta x_i}{x_{i-1}} \times 100} \tag{19}\]
where Δyi and Δxi refer to the changes in concentration in the organic and aqueous, respectively, upon extraction. Over all of the extraction stages in the process this is:
\[\ce{\%\,\text{extraction}
= \frac{O\,(y_1 - y_{n+1})}{A\,x_0}
= \frac{A\,(x_0 - x_n)}{A\,x_0}
\equiv \frac{x_0 - x_n}{x_0}} \tag{20}\]
where n is the number of extraction stages. Note that flowrate x concentration is mass flow. OΔyi, for instance, is the mass flow of copper into the organic in stage i, which by mass balance must equal AΔxi.
Extractant Considerations for SX
There are numerous extractant formulations available based on the few commonly manufactured oxime reagents (e.g. Table 3.1). The pure aldoximes require modifiers. The ketoxime is a moderate-strength extractant that is recommended for
PLS copper concentrations ≤1 g/L and pH ≥1.8 [1]. At lower pH it does not work as well. A very commonly used formulation is Lix 984N, which as explained previously is a 50/50 blend of the ketoxime (Lix 84) and the nonylsalicylaldoxime (Lix 860N) [2]. It is well suited to leach solutions with pH <1.8. Lix 622N is the nonyl- salicylaldoxime with tridecanol as modifier. This would be used in cases where the PLS pH was unusually low. It would require more than one stripping stage, though, due to its strong affinity for copper (Merigold 1996). Another Cognis product is Lix 973N. It is a 70/30 blend of Lix 860N and Lix 84. Having a higher aldoxime content it has a stronger affinity for copper and requires more than one stripping stage also (Merigold 1996). There are numerous other formulations with different modifiers and also using the dodecyl-salicylaldoxime and different modifiers (Merigold 1996). Avecia’s Acorga line offers further examples.
The higher the extractant concentration, the stronger its ability to extract copper. But, in turn, a higher concentration extractant will be more difficult to strip. One seeks to use a minimum extractant concentration because of the high cost of the reagent. (Reagents and diluents are obtained from petrochemical feedstock and hence their costs has been increasing on recent years.) A fraction of the reagent's total capacity is used in extraction. The unused portion (free [RH]) is simply the cost of doing business. And as mentioned before, not all the copper gets stripped, so part of the reagent is permanently tied up with a recirculating load of copper. One seeks to make this as small as possible. A common target for LIX 984N is to obtain 0.24-0.3 g Cu/L/Vol % of Cu transfer, i.e. 0.24-0.3 g Cu per L of organic solution per 1% of extractant concentration (10 mL extractant/L solution) (Cognis 2007).
Entrainment
When the aqueous and organic are mixed one phase is dispersed in a continuous fluid of the other. For instance, the aqueous phase may be present as droplets in the continuous organic phase, or the organic phase may be dispersed as droplets in a continuous aqueous phase. The former is called organic continuous, and the latter aqueous continuous. An illustration is given in Figure 4.8. As will be discussed later in this section, phase continuity has important implications for entrainment in SX. In the mixer a distribution of droplet sizes is generated. Then phase separation occurs in the settler. This process occurs in two discrete sections of a stage; a mixer followed by a settler. The primary break time is the time it takes to form a distinct aqueous-organic interface [3]. However, some droplets will be very small. These will coalesce only very slowly. (The time required is the secondary break time (Ritcey 2004).) In addition, the small organic droplets will rise very slowly through the aqueous phase (and small aqueous droplets fall slowly). A haze or cloudiness will persist in the phases. This is entrainment. It is one of the biggest problems in SX.
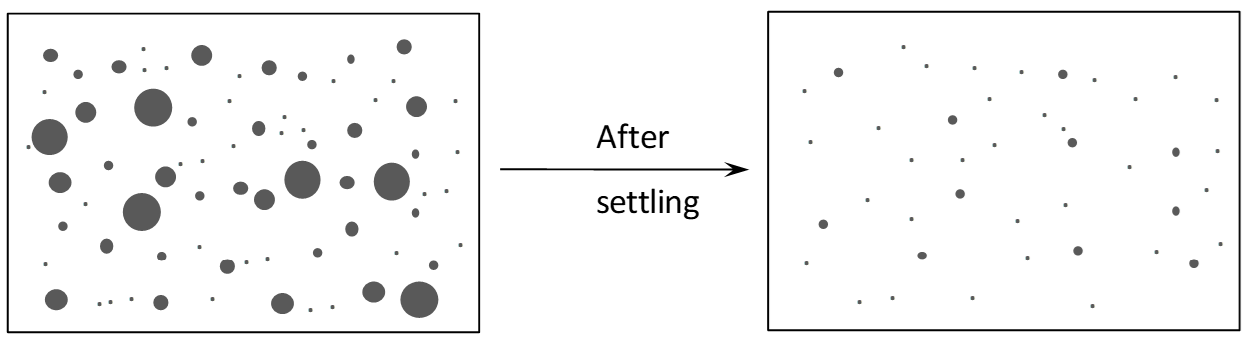
Figure 4.8 - Schematic illustration of droplet size distribution in SX mixing and entrainment left after settling. Note that one phase is dispersed as droplets in the other.There are a number of significant consequences of entrainment:
- Organic phase entrained in the raffinate removes SX reagent and diluent from the SX circuit. This organic reports to the raffinate pond (see Figure 1.2). If it is not recovered here (generally it can be only partially recovered), then it will be permanently lost. This is one source of organic loss from the circuit, which must be made up with fresh reagent.
- Aqueous entrainment of extracted PLS solution in the organic phase results in physical carryover of impurities into subsequent stages. Ultimately this entrained aqueous solution reports to the electrolyte in EW (see Figure 4.7). In stripping the organic, carrying entrained aqueous phase, is contacted with the spent electrolyte aqueous solution. The strip solution very efficiently absorbs the entrained aqueous from the loaded organic. This is one of the main mechanisms by which impurities in the PLS report to the electrolyte. (The other is by chemical extraction of impurities by the extractant, which is usually significant mainly for iron.) While chemical extraction can only carry over species that can chemically bond with the oxime, entrainment can transfer everything that is in the PLS. Major contaminants in typical PLS solutions are iron - both Fe(III) and Fe(II), manganese, aluminum (as Al(III) species), chloride and nitrate (if present). Traces of many other elements may also occur. Impurities in EW can have a couple major consequences (Merigold 1996). Current efficiency can be decreased, for example reduction of ferric ion to ferrous at the cathode. Manganese can be oxidized to MnO4-, a powerful oxidant that can degrade residual entrained organic and form solid MnO2 particles. Impurities can also have deleterious effects of cathode quality.
- Organic entrainment in the electrolyte can have cause complications in EW. Organic compounds may be slowly attacked by the strong acid (hydrolyzed) and/or oxidized at the anode or by oxygen, or perhaps MnO4-. This results in some degradation of the organic and represents another loss of organic that has to be made up. Also, cathode copper quality can be compromised. Organic compounds can adsorb on the cathode and lead to an unsightly discolouration called organic burn [4]. Worse, though, this can promote formation of a porous cathode product. Pores will contain electrolyte which is especially high in sulfate (copper sulfate and sulfuric acid) and this reports as a high sulfur contamination and lowers the value of the product.
- Electrolyte entrainment in the barren organic returning to SX extraction is a means of loss of the electrolyte from the EW circuit. As previously, the entrained aqueous in the organic is readily absorbed by aqueous solution in extraction. While the copper can be re-extracted, this does tie up a small fraction of the organic, making it less efficient. Copper EW electrolytes also contain cobalt (for reasons that will be discussed later) and this is permanently lost through entrainment. Cobalt sulfate is also an expensive reagent. Finally, acid in the entrained electrolyte solution will also be lost. This acid can lower the pH in the final extraction stage (2nd stage in Figure 4.7; nth in general) and lower copper extraction efficiency [5] (reaction 2).
The following are some important operational considerations regarding entrainment:
- In a mixture the dispersed phase is the most entrained phase (Spence & Soderstrom 1999).
- Aqueous continuous: maximizes organic entrained in the aqueous, minimizes aqueous entrained in the organic
- Organic continuous: maximizes aqueous entrained in the organic, minimizes organic entrained in the aqueous
- This is not to say that there is no entrainment of the continuous phase in the dispersed phase after settling, just that it is significantly less. The above statements should seem reasonable. Considering Figure 4.8, the dispersed phase is the one comprised of small droplets. Residual droplets in the continuous phase are the main source of its entrainment. The dispersed phase coalesces upon settling and contains less entrained phase.
- The implication of the preceding considerations is that if one wishes to have a cleaner aqueous phase, run organic continuous. Conversely, for a cleaner organic phase, run aqueous continuous.
- Ideally, phase continuity can be controlled in the mixers in order to minimize negative effects (Merigold 1996, Spence & Soderstrom 1999). Referring to Figure 4.7, it may be preferable to run extraction stage 1 mixer aqueous continuous. This minimizes entrainment of aqueous solution in the loaded organic going forward to stripping, and thence minimizes introduction of PLS impurities into the electrolyte. The more significant organic entrainment in the aqueous will go into stage 2. The stage 2 mixer could be run organic continuous. This will lessen organic entrainment in the raffinate, and hence lower the losses of organic from the circuit. The stripping mixer would then be run organic continuous in order to lessen organic entrainment in the electrolyte returning to EW. Of course, this results in a higher entrainment of aqueous phase in the barren organic returning to extraction, but often this is less problematic than higher organic entrained in the rich electrolyte.
- In practice, other problems may override the preceding “rules” about phase continuity (Spence & Soderstrom 1999). For example, sometimes phase separation times become excessively long (due to organic degradation and other factors). Running aqueous continuous can partially overcome this.
- Phase continuity can be monitored by a simple electrical conductivity measurement. The aqueous solution is much more conductive (due to dissolved salts) than the organic phase. A continuous aqueous phase will be electrically conductive. A continuous organic phase will not be conductive.
- The higher the concentration of the organic extractant, the greater the loss of extractant for a given level of entrainment or organic in an aqueous phase (e.g. the raffinate) [6].
- The nature of the entrainment in the continuous phase may be quite different from that in the dispersed phase. For example, if running aqueous continuous, a relatively small amount of aqueous will be entrained in the organic phase. Much of this will be in the form of thin films of aqueous surrounding organic droplets [7]. This phenomenon is called double phasing or fish eyes. It is readily visible if the phase is not highly coloured. The host droplets may be on the order of 1 mm size. The films are very thin. These tend to coalesce very slowly. The same may occur when running organic continuous (thin films of organic surrounding aqueous droplets). However, since the organic phase is typically very dark in colour and opaque, they are not readily seen.
- Air entrainment can also lead to double phasing (Merigold 1996). Here a thin film of entrained phase (e.g. aqueous) surrounds an air bubble and is suspended in the other phase (e.g. the organic). This is another reason why air entrainment in mixing can be deleterious and should be avoided.
Entrainment Design Considerations and Treatment
- The settler overflows typically have 500-1000 ppm (0.05-0.1% by weight) entrained phase. This is a normal design criterion (Miller et al. 1997). Generally additional procedures are applied to lower entrainments.
- SX EW plants have storage tanks for loaded organic and rich electrolyte for surge capacity. The tanks are in continuous use, but if these are not unduly agitated they can act as “after-settlers” (Miller et al. 1997, Merigold 1996). Entrained phase may have time to rise (organic in aqueous) or fall (aqueous in organic) and be collected. Recovered organic is first tested and if necessary purified prior to reintroduction to the SX circuit.
- Coalescers may be used to lower entrainments to 50-200 ppm for both aqueous and organic streams (Miller et al. 1997). Coalescers contain solid media that adsorb entrained droplets. A hydrophobic material is needed for the organic, e.g. PVC (polyvinylchloride). Similarly, a hydrophilic surface is needed for the aqueous, e.g. steel. These provide surfaces on which the small droplets adsorb and combine to fuse into larger droplets. The larger drops dislodge and readily coalesce with the bulk phases. Coalescers need to have large surface areas and not restrict flow. They may be placed in settlers, spanning the width of the flow path. An example is shown in Figure 4.9. A problem with coalescers is that they may be “blinded” by solids and crud. Periodic removal and cleaning may be necessary. Coalescers may be placed in other locations as well, such as an organic storage tank.
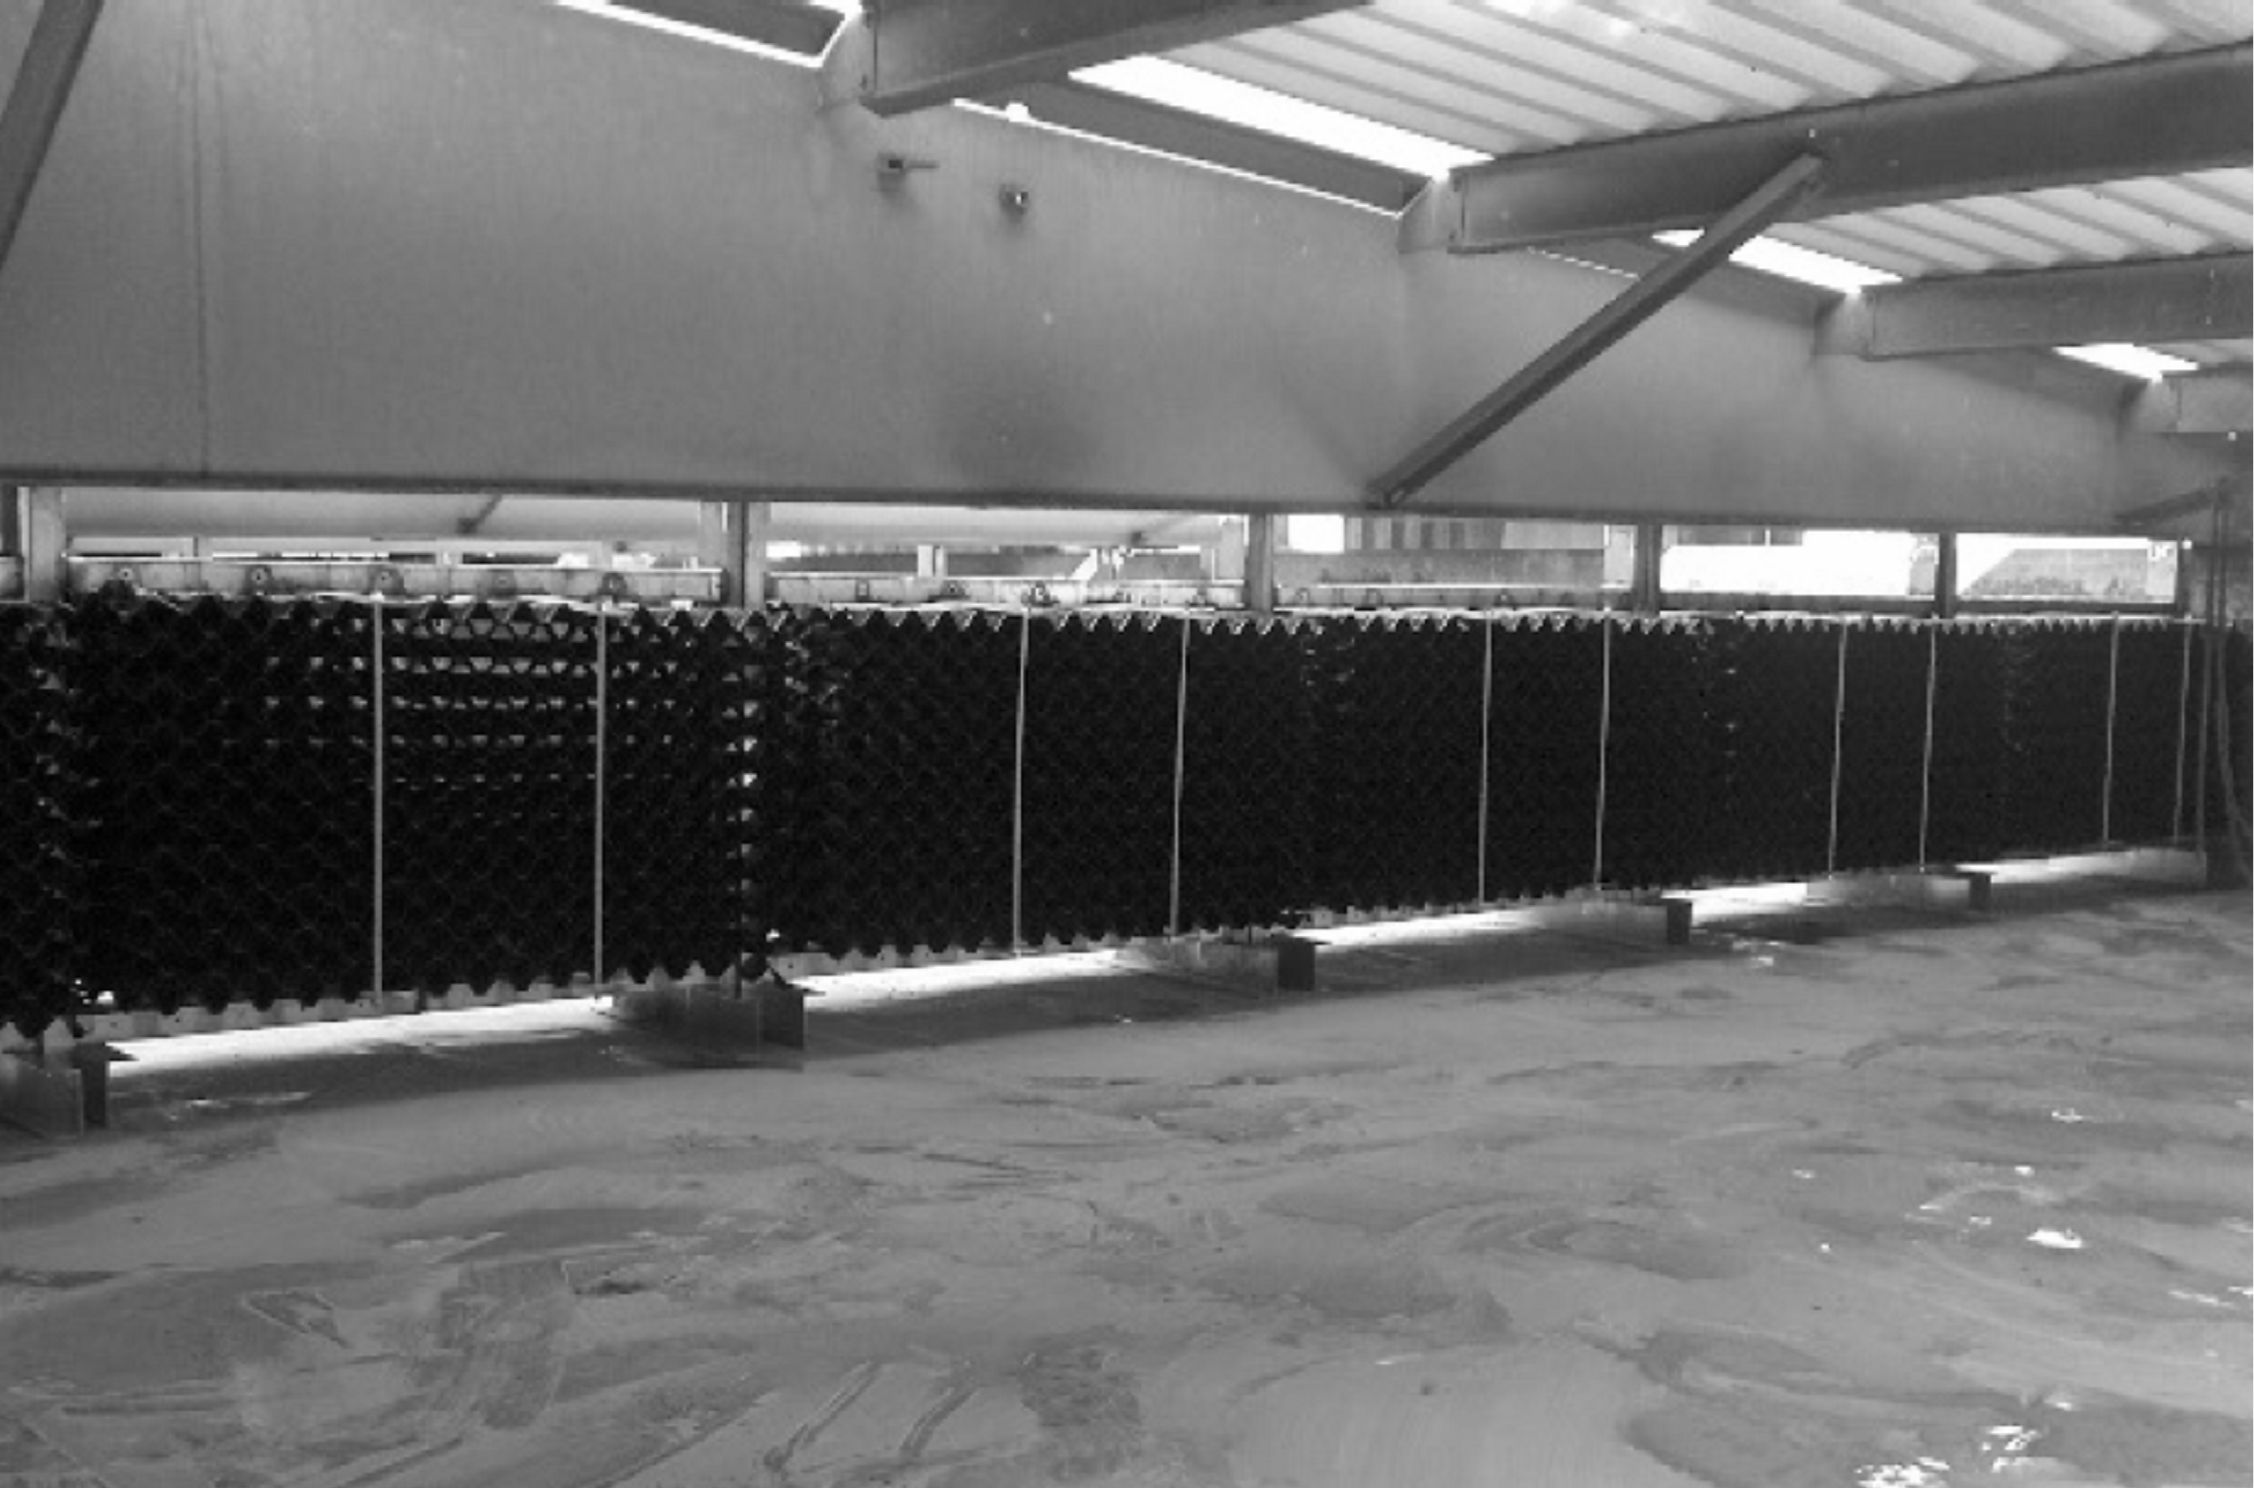
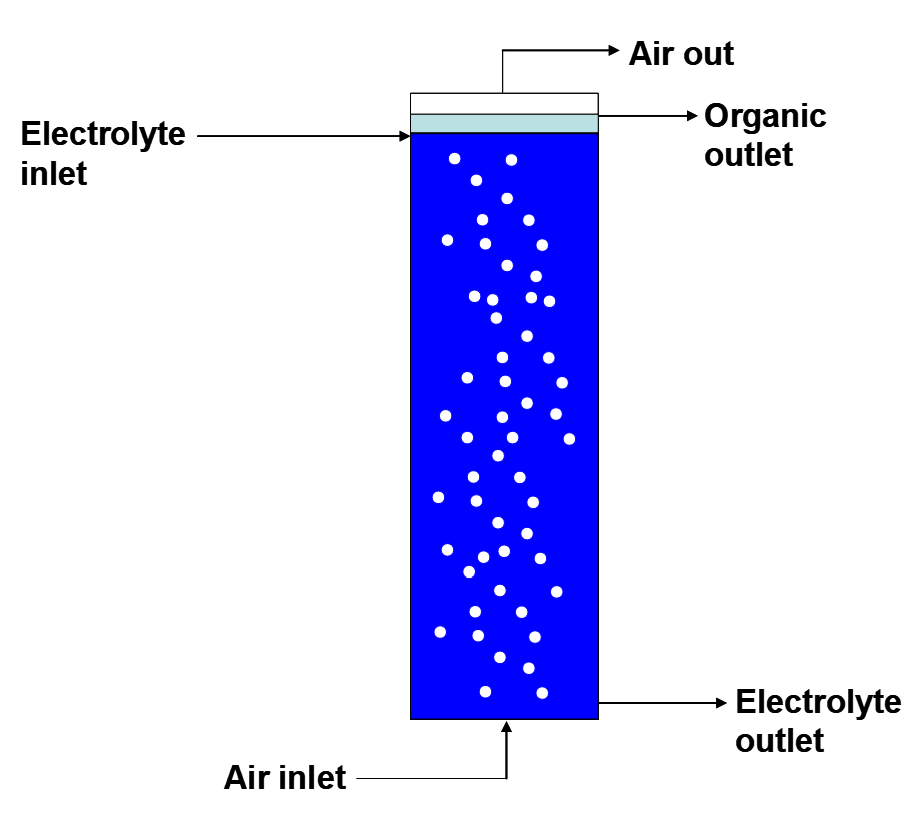
- Column flotation cells may be used to treat organic entrainment in the rich electrolyte prior to returning it to EW (Miller et al. 1997, Merigold 1996). A schematic illustration of column cell operation is shown in Figure 4.10. Air is driven up through a column of electrolyte; electrolyte is introduced near the top of the column (countercurrent flow). Small droplets of organic attach to the air bubbles, precisely analogous to sulfide mineral flotation. The organic droplets are carried to the top of the cell and coalesce there. Organic is them recovered purified and reintroduced to the SX circuit. Column flotation can reduce entrainment of organic in rich electrolyte to as low as 10 ppm.

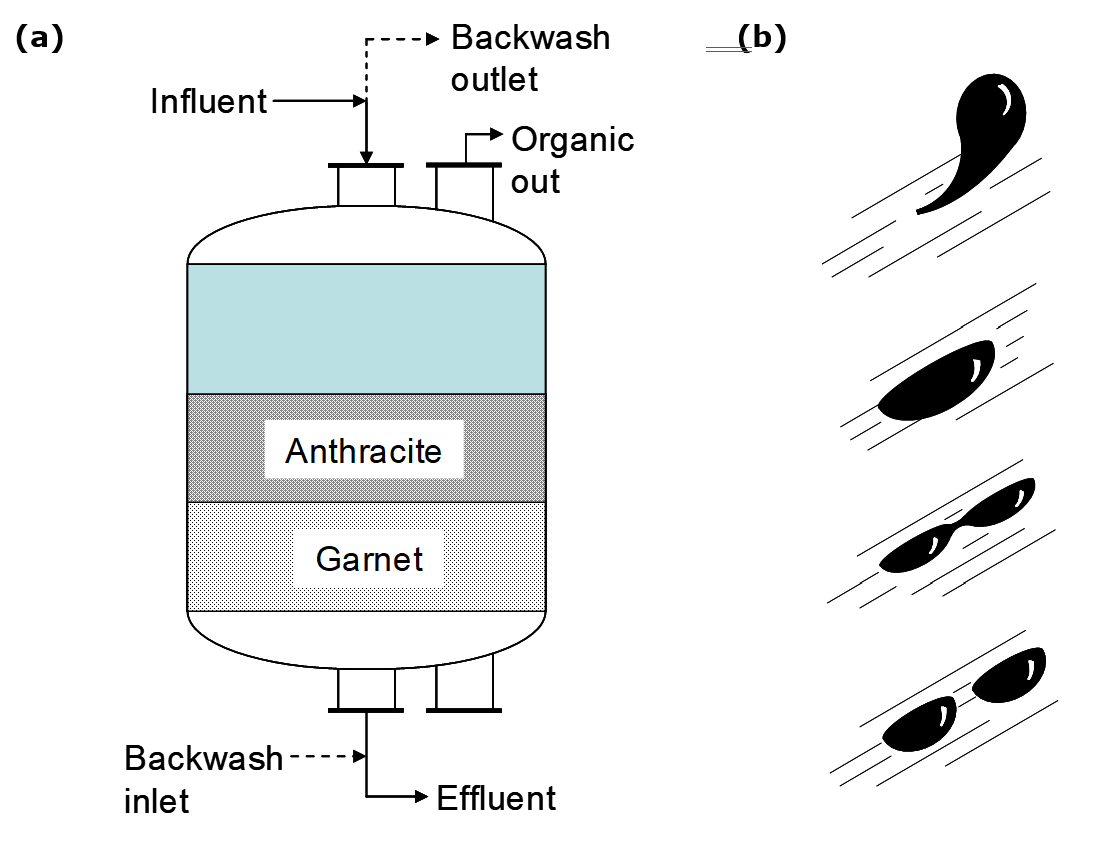
- Organic entrainment in the rich electrolyte can be further reduced by “sand filters” (Merigold 1996, Pfalzgraff 1999) also known as “dual media filters”. These do not actually use silica sand, since this would gradually dissolve in the strongly acidic electrolyte. (Dissolved silica can cause severe problems.) Rather garnet sand is used, as well as anthracite (coal). The garnet is principally used for removal of fine solids, which can cause problems in EW. It may also help promote coalescence of organic droplets in the electrolyte. The anthracite medium also adsorbs dissolved organics. Provision must be made for periodic backwashing of the filter in order to clean it of solids and accumulated organic. Lean electrolyte is used for this purpose. Since a bleed stream is taken from the lean electrolyte (for impurities removal) this may be used for backwashing. The backwash solution is treated for organic removal and recycled, e.g. to the PLS.
New filters (“co-matrix”) incorporate a third medium, like spongy poly-propylene as in Figure 4.11. These provide an additional surface for organic coalescence, and have small enough pore size to exclude larger organic droplets. Coalesced organic flows out the top in both types of filters. Periodic backwashing is required, however, the polypropylene layer need not be washed. A significant advantage of these types of filters is higher flowrates and lower backwash volumes. Dual media and co-matrix filters achieve the lowest electrolyte organic levels. Organic levels of <10 ppm are obtained, and may be as low as <2 ppm.
- Organic losses to the raffinate are <50 ppm for roughly half the world’s SX EW plants and 50-100 ppm for the other half [8]. Clearly the former is preferable.
- Organic losses to the electrolyte vary among the world’s SX EW plants (Jenkins et al. 1999). Roughly one fifth estimate this to be <5 ppm. Another one fifth is in the 5-10 ppm range. About one third have losses of 10-20 ppm and the remainder >20 ppm. For most the losses to the electrolyte are quite low, and this is necessary in order to maintain good copper product quality.
- Aqueous entrainment in loaded organic at one modern plant averaged 200 ppm after treatment with coalescers (Miller et al. 1997). This is probably fairly typical.
- Entrainment is one source of loss of extractant and diluent. It is a significant source, but by no means the only one.
Crud Formation and Treatment
Crud arises from fine, suspended solids (colloidal to ~1μm) in an aqueous-organic mixture undergoing mixing (Ritcey 2004). The exact nature of crud and how it forms is not well understood. However, crud causes a number of operational problems. Crud contains a relatively small amount of very fine solid particles (typically <5%) (Spence & Soderstrom 1999). This small amount of fine solids is able to stabilize a matrix of aqueous and organic solution (an emulsion) which remains separate from either the bulk aqueous or organic phases. Crud causes a number of problems (Spence & Soderstrom 1999):
- Crud retains organic solution and localizes it in a settler so that it is not available for extracting copper.
- Crud can be removed and treated in order to recover the organic, but the process is never complete. Furthermore, recovered organic may be partially degraded.
- It can build up in the settlers and lower the settler capacity over time.
- Crud may localize at the interface between the aqueous and organic. As it builds up in thickness it can hinder phase separation. (However, a small amount of crud at the interface can actually improve phase separation [9].)
- Crud can also be dispersed in one phase or the other in a settler.
- Whether it is localized at the interface or is suspended in a solution, crud can migrate from stage to stage and eventually into stripping. Here it can transfer impurities from the encapsulated aqueous phase into the electrolyte. Crud may even migrate into the EW cells and severely compromise cathode quality (Miller et al. 1997).
- Crud may be free-flowing in its host solution, or it may be sticky and adhere to surfaces (Miller et al. 1997).
- Crud can interfere with the normal functioning (block flow through) of coalescers.
- Crud build-up must eventually be rectified, or it will disrupt the operation of the plant. However, there are no fully automated means of removing crud. Hence a significant labour cost is involved.
There is a long list of possible causes for crud formation. A common feature seems to be fine solids. Common constituents are minerals or precipitates containing Si (e.g. silica or silicates), Al+3, Fe (e.g. jarosites), P (e.g. phosphate) and SO42-, gypsum (CaSO4·2H2O) and clay (Ritcey 2004). Some of the important ones are highlighted below:
- Very fine, suspended solids may enter SX with the PLS. PLS solutions are clarified prior to SX, but this may not be completely effective (Ritcey 2004), especially with sub-micron particles.
- Solids may precipitate due to chemical reactions between the extractant and some soluble species in the PLS.
- Solids may precipitate in stripping upon contact with the strong acid. Silica has slight solubility in aqueous solutions. If present in the PLS solution and entrainment carries over PLS into stripping, then silica may precipitate and initiate crud formation (Miller et al. 1997). Gypsum causes many problems in hydrometallurgical plants because it can persist at supersaturation for some time before precipitating. Changes in solution composition through SX may initiate gypsum precipitation [10].
- Modifiers in some oxime formulations might cause increased crud problems (Cognis 2007). In some instances this might involve oxidation of long-chain alcohols (e.g. from a tridecanol modifier) to form carboxylic acids, with enhanced promotion of crud formation (Ritcey 2004).
- Manganese in the PLS can enter the electrolyte through entrainment. Once in EW, Mn+2 can be oxidized to form MnO2, which is insoluble. Fine MnO2 precipitates can also be a source of crud in EW solutions (Miller et al. 1997).
Crud formation can be addressed in a number of ways. A few illustrative examples are provided:
- Efforts can be made to minimize crud. This can include lessening entrainment of PLS in loaded organic, with consequent lower additions of impurities to the electrolyte (Miller et al. 1997).
- Running mixers aqueous continuous often results in crud that floats throughout the organic layer. This will tend to forward easily to subsequent stages. However, running mixers organic continuous will tend to form a compact crud layer at the organic-aqueous interface, or the crud may wash out with the aqueous layer. This is more easily controlled and dealt with(Spence & Soderstrom 1999). Crud problems may override entrainment concerns with respect to choosing what phase continuity to run in mixing (Miller et al. 1997).
- Crud that results from suspended solids in the PLS tends to accumulate in the extraction stages. Crud that arises from colloidal (nano-scale) particles or chemical precipitates (formed upon contact with the electrolyte) tends to build up in stripping stages (Spence & Soderstrom 1999).
Organic Degradation Losses and Treatment
Both the extractant and the diluent are subject to loss and degradation by a number of mechanisms. These include:
- Entrainment losses. Efforts to lessen entrainment are becoming more common and more effective. Nevertheless, none of these are perfect. Example entrainment losses data are provided in the Entrainment Design Considerations and Treatment section. The chemical composition of the organic phase (extractant + diluent) tends to be same in the entrained phase as in the bulk [11].
- As noted above, crud formation is another mechanism for physical loss of extractant and diluent (Merigold 1996).
- Chemical degradation. This may be due to several factors including oxidation by oxygen, oxidation by other compounds, hydrolysis from contact with acid in the electrolyte, bacteria, and exposure to UV light (Bishop et al. 1999). The most significant mode of degradation is hydrolysis (Kordosky 2003). Hence, lower PLS pH and higher the acid concentration in the lean electrolyte promote more rapid degradation. Finally, increased temperature also accelerates oxime degradation (Cognis 2007). Ketoximes seem to be generally more stable toward chemical degradation than the aldoximes.
- Some of the degradation products may be water soluble. Many are surfactants, and these can lower surface tension, stabilize the dispersions and lengthen phase separation times (Bishop et al. 1999).
- Another source of extractant loss is the formation of stable complexes that do not strip with the strong acid of the lean electrolyte (Bishop et al. 1999). An example is molybdenum (as molybdate) (Cognis 2007). If this happens to be present in the PLS it will gradually lock up organic capacity, leaving less available for Cu SX. However, it is rare that significant concentrations of molybdenum occur. It is not an abundant element in the earth’s crust.
- Extractants and diluents are very slightly soluble in aqueous solutions. Naturally they are designed and selected to have minimal solubilities. Oxime solubilities in water are typically <1 mg/L and diluent solubilities are <5 mg/L (Bishop et al. 1999). The lighter hydrocarbons are more soluble than the heavier ones. Solubilities of extractant and diluent may be increased by the presence of surfactants in aqueous solution, arising from chemical degradation.
- Reagent and diluent losses represent an operating cost, since these have to be replenished. Total extractant consumption varies considerably (1.5-8 kg/t of Cu plated [12]), with an average of 2-3 kg/tonne (Merigold 1996).
- Organic recovered from entrainment and crud may have experienced significant chemical degradation. Before it can be returned to the SX circuit it needs to be tested. This may involve standard lab tests where the organic is shaken with a plant aqueous solution and phase separation time is monitored. In the laboratory fresh organic reagent will typically exhibit primary phase separation after mixing of 30-60 seconds, whereas with typical plant organic it will be 30-120 seconds (Spence & Soderstrom 1999). The standard procedure for treating partially degraded organic is to pass it through activated montmorillonite clay (Cognis 2007, Miller et al. 1997, Merigold 1996). This adsorbs polar organic molecules and cleans up the organic. After this and lab testing to verify performance the organic can be returned to the SX circuit.
Solvent Extraction Equipment - Mixers
The traditional SX equipment is the mixer-settler. This consists of two basic parts: the mixer(s) and the settler. In the mixer aqueous and organic solutions are contacted to form a dispersion. The purpose is to increase the interfacial surface area in order to obtain sufficiently fast rates of copper transfer between phases. Otherwise the process would be impractically slow. The size (volume) of the mixer(s) and the flow rates of the solutions determine the residence time in the mixer, or the contact time. This needs to be sufficiently long to ensure a substantial degree of reaction. However, in practice equilibrium is not generally attained. This would take too long for copper extraction with oxime reagents. Generally in copper extraction a steady state with >85% of the equilibrium compositions is achieved (Cognis 2007). (This is referred to as the stage efficiency.) The extent of conversion depends on the operation (extraction or stripping) and may vary between stages within extraction or stripping. Stripping can have >95% efficiency.
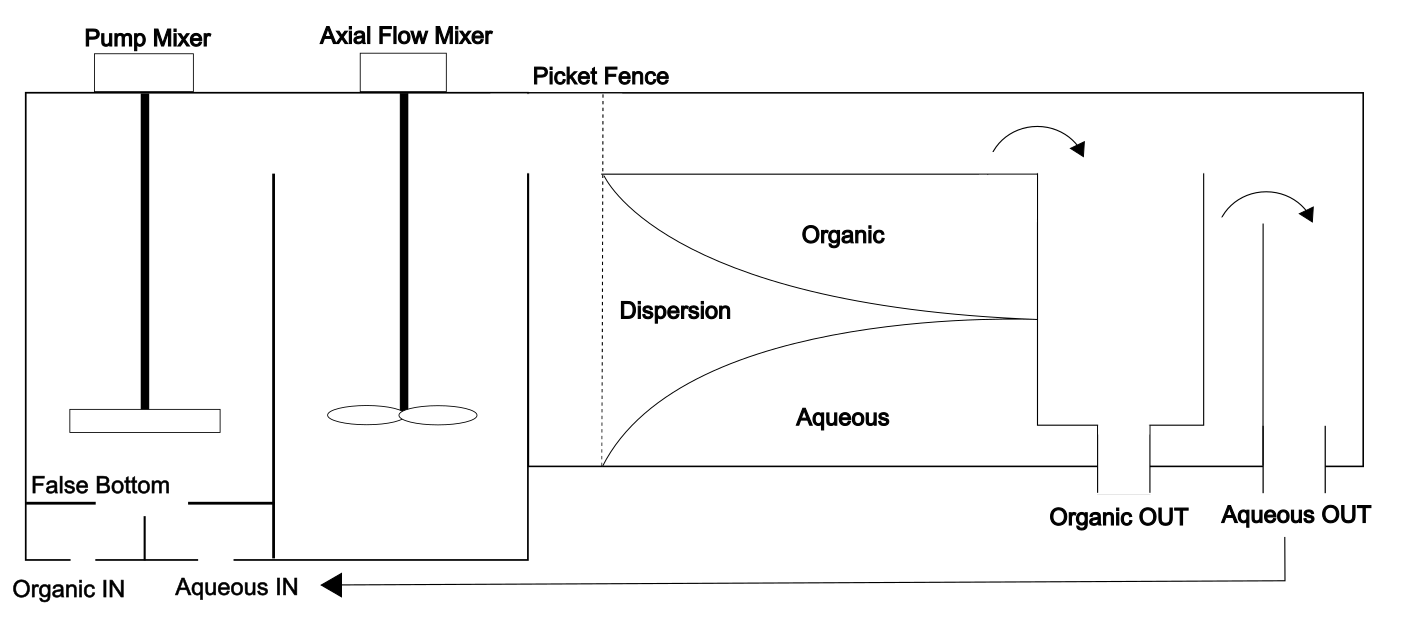
The mixed phases flow from the mixer into the settler, then separate, ideally into pure, individual aqueous and organic solutions. The organic phase is less dense and so rides on top of the aqueous. The densities are: organic about 0.85 g/mL; PLS through to raffinate about 1.0-1.05 g/mL, and; the electrolyte about 1.15 g/mL. Mixer-settlers operate continuously, not in batch mode. Hence there is constant flow. A schematic diagram of a mixer-settler is shown in Figure 4.12.
The following are some important design considerations for mixers:
- There is a limit to the maximum size of a mixer-settler. If too large it becomes difficult to maintain uniform flow through the settlers. (Uniform flow is crucial for good phase separation.) Thus it is common to have more than one SX train to treat large PLS flow rates. Most mixer-settlers have capacities of 300-3000 m3/h of each of aqueous and organic solutions (Jenkins et al. 1999). Each train transfers 20-250 tonnes of copper to the EW electrolyte per day [13].
- There may be up to three mixers in series for large, modern plants. Note: mixer vessels may be square or cylindrical (Jenkins et al. 1999). For smaller plants with lower production, a single stage of mixing may be sufficient (also, the small scale may not justify the added expense of another mixer). However, single stage mixers are less efficient than multi-stage mixers (Spence & Soderstrom 1999). There is a range of probabilities for a volume of solution to remain in the mixer for a given amount of time. When mixing is spread out over more than one stage, that probability increases. Note that the first mixer is the one into which both the aqueous and organic streams flow.
- The impeller in mixer number 1 is placed quite close to the inlet. This is to provide sufficient suction in order to transport solutions. The extent of suction can be controlled by raising or lowering the impeller (Merigold 1996). The impeller itself in number 1 box is typically a radial flow turbine, having vertical blades on the underside of a flat plate. There are different designs, but the basic features are general. The vertical vanes provide shear to create a dispersion of one phase in the other. Recall that high shear is needed for generating surface area (small drops) in a two-phase liquid system, or a gas-liquid system. The radial flow impellers have diameters about 2/3 to 3/4 of the mixing box width. This is to keep them from having to be turned too quickly, which would impart too much shear and create very small droplets (Davenport et al. 2002, Merigold 1996). If droplet sizes become too small, then coalescence in the settler will take too long. The impeller tip speed should be kept <400 m/min (Davenport et al. 2002, Spence & Soderstrom 1999). A good criterion for impeller design is that the product N3D2 < 1.9 m2/s3 (<20 ft2/s3) (Merigold 1996), where N is rotation rate in s-1 and D is the diameter. Thus the product of the (rotation rate)3 times the (impeller diameter)2 should be less than 1.9 m2/s3. (The term N3D2 falls out of the theory associated with SX mixing and won’t be elaborated on here.)
- The mixing box has baffles as indicated. The purpose is to lower the centrifugal forces which would tend to cause premature phase coalescence. (Centrifuging drives the heavier phase to the outside; the lighter to the inside and puts pressure on droplets to coalesce.) This would slow the reaction due to loss of surface area. Baffles also prevent vortexing, which raises the mixture along the edges, converting (and wasting) kinetic energy into gravitational potential energy
- The second mixer in Figure 4.12 has a regular axial-flow impeller. Once the dispersion is created in the first mixer further shear will continue to decrease drop size, which again, is undesirable with respect to subsequent phase separation. The second impeller then is used to maintain the dispersion; the first to create it.
- A typical residence time in the mixer system is 2-3 minutes (Davenport et al. 2002, Merigold 1996). If there are two mixers the time will be 1-1.5 minutes in each. Shear agitation for 2-3 minutes will generate a lot more small drops than shear agitation for 1-1.5 minutes. Consideration of the solutions' flow rates and the residence time permits estimation of the size of the mixers.
- Note how the flow goes between the two mixers in Figure 4.12. It is directed down near the top of box number 1 to the bottom of the number 2. This is to minimize premature exit of solutions from the mixer, across the top (called short-circuiting). (The piece of equipment is called a downcomer.)
- In the mixer it is important that the phase ratio be close to one. Significant deviations from this result in inefficient mixing and slower extraction kinetics. For example, if there is a high volume of aqueous and a small volume of organic, the relatively small volume of organic droplets will have to travel through a greater distance to contact all the aqueous phase. This takes time (i.e. poor interfacial contact). Another important reason is that if A/O differs significantly from one, the dispersed phase droplets become smaller, which slows coalescence in the settler. A phase ratio of close to one gives the most efficient mixing and subsequent phase separation (Merigold 1996)[11,20]. The phase flow ratio in the mixer should be within the range 0.65 < A/O < 1.5 [20]. However, in practice, the A/O ratio, and especially the O/As ratio in stripping, may differ significantly from one. This problem is overcome by recycling equilibrated (or almost equilibrated) phase from the settler back to the mixer (Merigold 1996). For instance, if we are running stripping at O/As = 4, then recycling 3As m3/h from after the settler back to the mixer will keep the phase ratio throughout the mixer settler at one. This does not change the phase ratio through the overall process. The recycle stream flow out post-settler is precisely matched by the increased flow back in from the mixer. It does require an additional inventory of solution. In addition, the recycled phase will have already gone through the extraction/stripping process and have attained its final concentration. So the steady state composition in the mixer is not greatly changed.
- The A/O ratio for new, fresh flows into the mixer is called the advance A/O ratio. The A/O ratio in the mixer with recycle is called the A/O with recycle. Likewise the O/A ratio. • Based on the discussion on entrainment in the preceding section, the phase continuity in the mixer is an important issue. The desired phase continuity may be maintained by having a slight excess of that phase. For instance, to maintain organic continuity the O/A ratio with recycle may be maintained at about 1.1 [20]. This is sufficient to ensure that the desired phase continuity is maintained. Any ratio > 1 tends toward the dominant phase being continuous, but as the ratio approaches 1 it becomes less certain.
- Another important consideration in mixing is to avoid mixing air into the dispersion(Merigold 1996). This creates a three-phase system (aqueous, organic and gas). Subsequent phase separation will be more difficult (slower) (Merigold 1996)[11,20]. In addition increased exposure to oxygen can more rapidly chemically degrade the extractant and the diluent (Bishop et al. 1999).
Solvent Extraction Equipment - Settlers
Settlers are the part of the equipment where phase separation occurs. As the dispersion leaves the mixers it begins to separate. The settler is large enough to permit a moderately slow flow of the phases. The phases coalesce and aqueous descends, while the organic rises. As can be seen from Figure 4.12 a dispersion band (aqueous-organic mixture, or emulsion) forms that gradually thins as most of the mixture coalesces. The following are some important design considerations:
- The best separated organic phase in the settler is near the top of the layer (aqueous falls), hence organic phase is withdrawn by overflow from a weir at the end of the settler (Figure 4.12). The best quality aqueous is at the bottom of the layer (organic rises). Hence the aqueous is withdrawn from the bottom of the settler and directed over the weir beyond the organic weir.
- Modern, large settlers are typically close to square in layout, although length:width ratios of up to 3:1 are possible (Merigold 1996).
- Settlers should have floor areas that allow for total (aqueous + organic) specific flows of 3.6-4.8 m3/h/m2 floor area (this is not a flux) (Merigold 1996).
- The ideal A/O ratio in a settler is close to 1:1 (Merigold 1996). If the flow rates differ significantly then the two phases may end up moving at quite different linear velocities along the length of the settler (or space velocities). This in turn will create shear and turbulence at the interface, which in turn will hinder proper phase separation.
- As in mixing, the phase ratio in the settler is controlled by recycle streams.
- The organic depth in the settler is usually 24-30 cm (Davenport et al. 2002, Merigold 1996). It can’t be too shallow or the space velocity will become too large, and there may not be enough depth to provide a suitably separated (from aqueous phase) organic at the end of the settler. A high space velocity may induce too much turbulence as well, hindering phase separation. On the other hand, it is desirable to keep the organic depth to a minimum in order to lower costs (the organic is expensive).
- The aqueous depth in the settler is usually 30-50 cm (Davenport et al. 2002). The velocities of the phases can be controlled by varying their depths. If the depths are different, then the phase ratio with recycle in the settler should, ideally, be such that the difference in interfacial velocities is small.
- The aqueous and organic solutions flow over weirs. The organic weir tends to be at fixed height, whereas the aqueous weir can be adjusted in height. This allows control over the organic and aqueous solution depths (Merigold 1996). The densities of the phases may change from stage to stage as well and having an adjustable weir allows for good control of phases depths [14].
- The thickness of the dispersion band (e.g. near the exit end of the settler) increases as the droplet size decreases (Ritcey 2004). Smaller drops take longer to coalesce. Increasing the degree of agitation, or the duration of high-shear mixing results in smaller droplet sizes.
- The space velocities (linear flow velocity through the settler) of the organic should be in the range of about 2-6 cm/sec (Davenport et al. 2002). Lower flow rates are not necessary, and higher flow rates may yield poor phase separation. The space velocity can be calculated from the flow rate and the cross sectional area of the phase in the settler. Assume a total flow rate A + O of 1936 m3/h and O:A = 1. The settler floor area can be calculated from a specific flow, say 4.0 m3/h/m2:
\[\frac{1936\ \text{m}^3/\text{h}}{4.0\ \text{m}^3/\text{h}/\text{m}^2}
= 484\ \text{m}^2\ \text{floor area} \tag{21}\]Assuming a square settler the dimensions will be 22m x 22 m. Assuming an organic depth of 30 cm the cross sectional area of the organic phase will be 6.6 m2. The organic flow rate is 1936/2 = 968 m3/h. Then the organic space velocity will be:
\[\frac{968\ \text{m}^3/\text{h}}{6.6\ \text{m}^2}= 146.7\ \text{m/h}= 4.07\ \text{cm/s} \tag{22}\]
The flow rates of the organic and aqueous, their depths in the settler and the settler dimensions all affect the linear velocities of the phases. As the preceding calculations show, if the O:A ratio differs significantly from one we can expect a significant difference in space velocities for the two phases, which will contribute to turbulence and poorer phase separation, particularly near the interface. As a result, it is important to keep a sufficient organic depth.
- The residence time of a phase in a settler can be calculated. It is just the length of the settler divided by the linear velocity of the phase. For the example above., the residence time of the organic phase is:
\[\frac{22\ \text{m}}{146.7\ \text{m/h}} \times 60\ \text{min/h} = 9.0\ \text{min} \tag{23}\]
Typical residence times are roughly 10-20 minutes (Davenport et al. 2002). Phase separation in the plant may be considerably longer than when tested in a laboratory (Davenport et al. 2002). This can arise from real-life complexities related to slow degradation of the organic and the composition of the PLS.
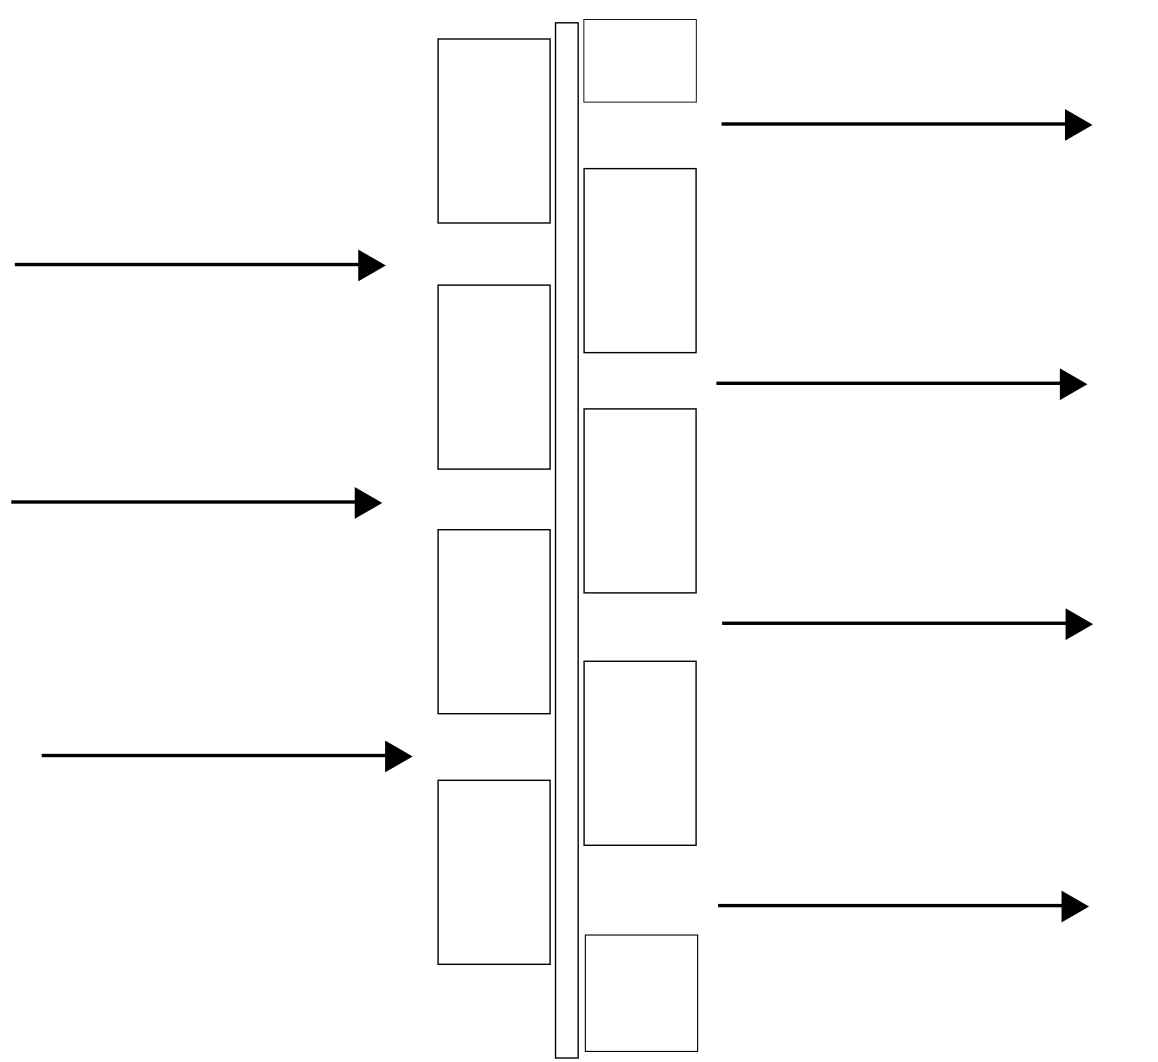
It is crucially important that the flow of the phases through the settler be as uniform (laminar) as possible, otherwise turbulence will result and phase separation will be poor. Considerable effort goes into engineering this aspect of settlers. In order to achieve uniform flow, the dispersion exiting the mixer must be evenly distributed across the width of the settler. This is typically done by means of “picket fences”. An example is shown in Figure 4.13. The spaces between the slats are roughly 10% of the cross sectional area. The fence should be close to the inlet end of the settler and should provide enough resistance to flow to cause a small hydrostatic head at the rear (e.g. 2-3 cm for small settlers). The Picket fence surfaces may also act to promote coalescence of phases. Small droplets can adhere weakly to the surface and be kept in close contact, speeding coalescence. For larger settlers, there may be more than one picket fence.
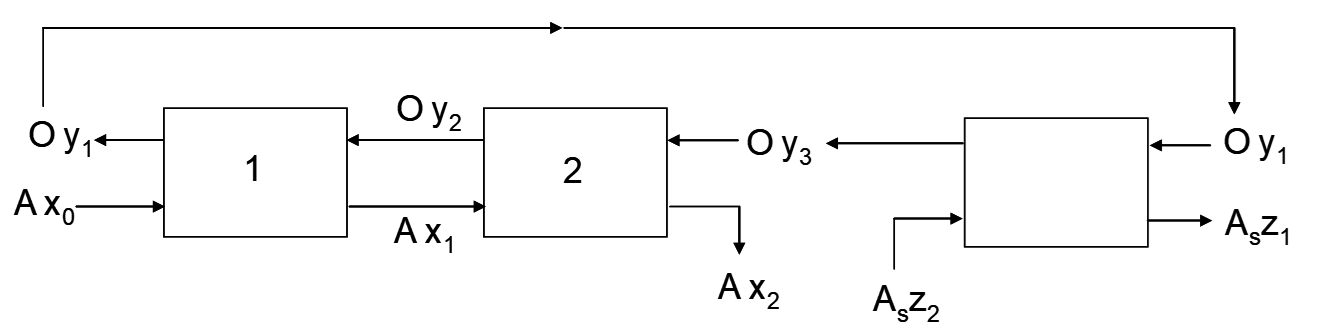
Series-Parallel Staging
The countercurrent mode illustrated in Figure 4.1 is sometimes called series extraction. In copper SX two or three extraction stages in series is typical. More recently a new configuration has been applied, called series-parallel extraction (Davenport et al. 2002). In this arrangement, there are three extraction stages. Briefly, the barren organic from stripping enters stage 3 and is contacted with a fraction of the PLS solution (the PLS is split into two streams). The exiting aqueous solution is a raffinate stream (only one contact with organic). The partially loaded organic proceeds to stage 2, and after copper extraction, it enters stage 1. The remaining PLS enters stage. Due to its relatively high copper concentration it enhances organic loading of copper considerably. The aqueous exiting stage 1 and the organic exiting stage 3 are mixed in stage 2. A second raffinate stream exits stage 2. Stages 1 and 3 operate in parallel, both using PLS. Stages 1 and 2 act in series.
The advantage of this configuration is that it increases the rate at which PLS enters the circuit (by about double), and hence can significantly increases the productivity of the plant. One disadvantage is that extraction efficiency of copper from the PLS is lower than a conventional series circuit.
Loaded Organic Scrubbing
Scrubbing (or washing) may sometimes need to be performed on the loaded organic after extraction and prior to stripping. There are two main purposes:
- • To remove entrained aqueous solution (extracted PLS) and its associated impurities, so as to keep these below harmful levels in EW (especially iron, manganese, chloride and nitrate where these are present at high levels in the PLS) (Merigold 1996). If chloride in the PLS exceeds 1000-2000 mg/L then a scrub stage may be necessary (Kordosky). The water source for some plants may be quite high in chloride to begin with.
- • To remove chemically extracted iron from the oxime extractant, again to keep excess iron out of EW [15]. A PLS with ~1 g/L copper and >5 g/L iron (depending on the ferric-ferrous ratio; only ferric ion is extracted) may require a scrub stage (Spence & Soderstrom 1999). The scrub reaction may involve both acid stripping and copper “crowding” of iron off the extractant:
\[\ce{FeR3_{(org)} + \tfrac{3}{2}H2SO4_{(aq)}
-> \tfrac{1}{2}Fe2(SO4)3_{(aq)} + 3RH_{(org)}} \tag{24}\]
\[\ce{FeR2(Cl)H2O_{(org)} + H2SO4_{(aq)}
-> FeSO4(Cl)_{(aq)} + 2RH_{(org)} + H2O_{(l)}} \tag{25}\]
\[\ce{FeR3_{(org)} + CuSO4_{(aq)} + \tfrac{1}{2}H2SO4_{(aq)}
-> \tfrac{1}{2}Fe2(SO4)3_{(aq)} + CuR2_{(org)} + RH_{(org)}} \tag{26}\]
\[\ce{FeR2(Cl)H2O_{(org)} + CuSO4_{(aq)}
-> CuR2_{(org)} + FeSO4(Cl)_{(aq)} + H2O_{(l)}} \tag{27}\]
Scrub solutions consist mainly of dilute sulfuric acid (~10-15 g/L) (Kordosky). The acid concentration should exceed that of the aqueous solution in extraction stage number one, from which the loaded organic came. The iron (especially) loaded from a solution that had a modest acid concentration in the first place. Extracting it off again will need a higher concentration of acid. However, the acid concentration should not be so high as to strip off a lot of copper. Inevitably a small amount of copper strips off until a modest concentration builds up in the aqueous solution (around 5-10 g/L). In addition, copper present in the scrub solution will displace some of the iron from the oxime (since the copper complex is much more stable).
Note that some small amounts of chloride (30-40 mg/L (Kordosky)) and iron (0.8-1.5 g/L (Kordosky 2000), ideally, but certainly <3 g/L (Merigold 1996)) are actually beneficial in EW.
Scrubbing may have a number of potential benefits (Kordosky 2000):
- EW solution must be bled at a steady rate that is a fairly small fraction of the total flow rate. This is done to prevent excessive build-up of impurities. Scrubbing the loaded organic can lessen the bleed rate by removing iron and entrained aqueous phase from extraction. (Bleeding has costs associated with loss of copper, acid and costly additives.)
- Copper from the EW bleed is recycled, e.g. to the PLS. But this ties up some copper as an inventory cost. Less bleed volume lowers this cost.
- Copper removed with the bleed may be re-introduced to the SX circuit (e.g. with the PLS), but this recirculating load of copper ties up some of the valuable organic extractant and represents an unproductive operating cost. Again, a lower bleed rate lessens this cost.
- An economic analysis is needed to determine if the scrubbing is justified.
The following are some relevant design and operating considerations for scrubbing:
- The scrub aqueous solution advance O/A ratio should be high; about
10-50:1 (Kordosky). Relatively small concentrations of impurities are being removed from the organic, so large aqueous volumes are not necessary. Further, the larger the aqueous scrub solution volume, the more of it there is to deal with afterwards. A recycle stream is directed back to the mixer to keep the O/A with recycle near one, as with other SX stages. - A portion of the EW bleed stream may be taken and diluted to make up the scrub solution (Spence & Soderstrom 1999). For example, if the lean electrolyte contains 30 g/L Cu+2 and 180 g/L H2SO4, a 1:18 dilution will yield a solution containing 1.7 g/L Cu+2 and 10 g/L H2SO4. One advantage of this is that since an EW bleed has to be taken anyway, some of it can be used directly in this way.
- Impurities will build up in the used scrub solution. A bleed is also taken from it in order to keep impurities at a suitably low level. The bleed may be combined with the PLS (with, or without any further purification) (Kordosky) in order not to lose copper. Copper will build up to modest concentrations, as noted above. In the end a steady state scrub solution composition is attained.
- The mixing and settler retention times should be the same as those for other parts of the SX circuit. There was prior thought that these could be significantly shorter, but that has proven to be inefficient (Kordosky 2000).
- Entrained aqueous solution in the loaded organic is washed into the scrub aqueous solution. In the end, the scrubbed organic may still have a similar level of entrained aqueous solution, but it will now be much more dilute (on the order of 10-1000 times) (Spence & Soderstrom 1999).
- Removal of chemically extracted iron from the oxime can range from 50% to 80% (Spence & Soderstrom 1999, Kordosky 2000).
- Coalescers cannot remove chemically extracted iron, only entrained solution. Scrub stages can remove extracted iron and significantly dilute entrained aqueous in the loaded organic going forward to stripping (Kordosky 2000).
Media Attributions
- Ch6_F10_Extraction_Circuit_Schematic © Bé Wassink and Amir M. Dehkoda is licensed under a CC BY-NC (Attribution NonCommercial) license
- Ch6_F11_Two_Stage_Extraction_Circuit © Bé Wassink and Amir M. Dehkoda is licensed under a CC BY-NC (Attribution NonCommercial) license
- Ch6_F12_Org_Copper_Conc_AO_Ratio © Bé Wassink and Amir M. Dehkoda is licensed under a CC BY-NC (Attribution NonCommercial) license
- Ch6_F13_Copper_Extraction_McCabe_Thiele © Bé Wassink and Amir M. Dehkoda is licensed under a CC BY-NC (Attribution NonCommercial) license
- Ch6_F14_Alternative_McCabe_Thiele © Bé Wassink and Amir M. Dehkoda is licensed under a CC BY-NC (Attribution NonCommercial) license
- Ch6_F16_Single_Stage_McCabe_Thiele © Bé Wassink and Amir M. Dehkoda is licensed under a CC BY-NC (Attribution NonCommercial) license
- Ch6_F17_Two_Stage_Extraction_One_Stage_Stripping © Bé Wassink and Amir M. Dehkoda is licensed under a CC BY-NC (Attribution NonCommercial) license
- Ch6_F18_Droplet_Size_Distribution © Bé Wassink and Amir M. Dehkoda is licensed under a CC BY-NC (Attribution NonCommercial) license
- Ch6_F19-1_Coalescer_Bundle © Bé Wassink and Amir M. Dehkoda is licensed under a CC BY-NC (Attribution NonCommercial) license
- Ch6_F19-2_Coalescer_Bank © Bé Wassink and Amir M. Dehkoda is licensed under a CC BY-NC (Attribution NonCommercial) license
- Ch6_F20_Column_Flotation_Cell © Bé Wassink and Amir M. Dehkoda is licensed under a CC BY-NC (Attribution NonCommercial) license
- Ch6_F21_Dual_Media_Droplet_Coalescence © Bé Wassink and Amir M. Dehkoda is licensed under a CC BY-NC (Attribution NonCommercial) license
- Ch6_F22_Two_Stage_Mixer_Settler © Bé Wassink and Amir M. Dehkoda adapted by Jeno Hwang is licensed under a CC BY-NC (Attribution NonCommercial) license
- Ch6_F23_Picket_Fence © Bé Wassink and Amir M. Dehkoda adapted by Jeno Hwang is licensed under a CC BY-NC (Attribution NonCommercial) license
- Ch6_F24_Series-Parallel_SX_Circuit
- C.R. Merigold, Lix Reagent Solvent Extraction Plant Operating Manual, Cognis Corp., 2nd edn, 1996. Retrieved Feb. 18, 2009 at: http://www.cognis.com/NR/rdonlyres/97088921-AD31-461E-A120-9C2B791ACD26/0/lixsolve.pdf ↵
- Cognis Group, MCT Redbook. Solvent Extraction Reagents and Applications, 2007. Retrieved Feb. 21/09 at: http://www.cognis.com/NR/rdonlyres/7A687186-A305-4969-B6EA-0CF869930714/0/MCT_Redbook_English.pdf ↵
- G.M. Ritcey, “Development of an industrial solvent extraction process,” in Solvent Extraction Principles and Practice, 2nd edn., J. Rydberg, M. Cox, C. Musikas and G.R. Choppin, eds., Marcel Dekker, 2004, pp. 277-337. ↵
- C.L. Pfalzgraff, “Do’s and don’ts of tankhouse design and operation,” in Copper Leaching, Solvent Extraction, and Electrowinning Technology, G.V. Jergensen II, ed., Society for Mining, Metallurgy and Exploration, 1999, pp. 217-221. ↵
- (a) J.R. Spence and M.D. Soderstrom, “Practical aspects of copper solvent extraction from acidic leach liquors,” in Copper Leaching, Solvent Extraction, and Electrowinning Technology, G.V. Jergensen II, ed., Society for Mining, Metallurgy and Exploration, 1999, pp. 239-257. (b) A very slightly different version of this article can be accessed at (Feb. 21/09): http://www.cytec.com/specialty-chemicals/pdf/practical.pdf ↵
- G. Kordosky, “Copper SX circuit design and operation - current advances and future possibilities,” Presented at: ALTA 2003 Conference. Retrieved Feb. 18, 2009 at: http://www.cognis.com/NR/rdonlyres/543999B6-91A7-4819-A7FB-60692EE2AF5C/0/Alta_2003.pdf ↵
- G.M. Miller, D.J. Readett and P. Hutchinson, “Experience in operating the Girilambone copper SX-EW plant in changing chemical environments,” Minerals Engineering, 1997, Vol. 10, No. 5, 1997, pp. 467-481. ↵
- J. Jenkins, W.G. Davenport, B. Kennedy and T. Robinson, “Electrolytic copper -leach, solvent extraction and electrowinning world operating data,” Proceedings of the Copper 99 – Cobre 99 International Conference, S.K. Young, D.B. Dreisinger, R.P. Hackl and D.G. Dixon, eds., Phoenix AZ, Oct. 10-13, 1999, Vol. 4, pp. 493-567. ↵
- M.J. Virnig, S.M. Olafson, G. Kordosky and G.A. Wolfe, “Crud formation: field studies and fundamental studies,” Proceedings of the Copper 99 – Cobre 99 International Conference, S.K. Young, D.B. Dreisinger, R.P. Hackl and D.G. Dixon, eds., Phoenix AZ, Oct. 10-13, 1999, Vol. 4, pp. 291-304. ↵
- G. Kordosky, M. Virnig and M. Mackenzie, “Solvent extraction - reagents and selectivity control,” Cognis Corp. Retrieved Feb. 18, 2009 at: http://www.cognis.com/products/Business+Units/Mining+Chemicals/Literature/General+Publications/ ↵
- M.D. Bishop, L.A. Gray, M.G. Greene, K. Bauer, T.L. Young, J. May, K.E. Evans and I. Amerson-Treat, “Investigation of evaporative losses in solvent extraction circuits,” Proceedings of the Copper 99 – Cobre 99 International Conference, S.K. Young, D.B. Dreisinger, R.P. Hackl and D.G. Dixon, eds., Phoenix AZ, Oct. 10-13, 1999, Vol. 4, pp. 277-289. ↵
- M.S. Prasad, V.P. Kenyen and D.N. Assar, “Development of SX-EW process for copper recovery-an overview,” Mineral Processing and Extractive Metallurgy Review, 1992, vol. 8, pp. 95-118. ↵
- W.G. Davenport, M. King, M. Schlesinger and A.K. Biswas, Extractive Metallurgy of Copper, 4th edn., Pergamon, 2002. ↵
- P.J.D. Lloyd, “Principles of industrial solvent extraction,” in Solvent Extraction Principles and Practice, 2nd edn., J. Rydberg, M. Cox, C. Musikas and G.R. Choppin, eds., Marcel Dekker, 2004, pp. 339-366. ↵
- G. Kordosky, S. Olafson and C. Hahn, “Iron control strategies in copper solvent extraction plants, the case for a wash stage,” Randol Conference, 2000. Retrieved Feb. 23/09 at: http://www.cognis.com/NR/rdonlyres/B159035F-B210-47AD-81ED-96771D437E82/0/Iron_Control_Strategies_Randol_Conference.pdf ↵
