Chapter II: Mineral Processing
6. Particle Selection – Making Concentrates
Where grinding is practiced to achieve liberation of the minerals the final goal is to make one or more concentrates. This is what will be described in the rest of these notes. Concentration involves physical processes for selecting minerals of interest. The composition of the minerals remains unchanged. A concentrate contains the mineral(s) of interest at higher grade than in the feed material. Several types of physical properties can be exploited for the purpose, so long as different minerals possess the property to differing degrees. Common physical properties that can be employed are:
- Density
- Attraction to/repulsion from a magnetic field
- Attraction to/repulsion from an electric field
- Hydrophobicity resulting in attachment to an air bubble
Different minerals may possess a physical property to differing extents. For example gold is very dense (19.3 g.cm3). Common silicate minerals have densities <4 g/cm3. This great difference in densities allows development of machines to separate gold particles from other minerals. One might expect minerals to have a fixed values of physical properties. In practice this is not the case. Rather minerals have a range or distribution of values for physical properties. There are a number of reasons for this. Typically minerals are not actually pure. For example zinc sulfide often contains variable amounts of iron; (Zn,Fe)S. Likewise pentlandite (Ni,Fe)9S8. Some minerals have variable composition such as pyrrhotite which is Fe1-xS with x = 0-0.2. Gold may be alloyed with silver and possibly other metals as well (electrum), or Se or Te. Liberation is never perfect and so composite particles will exhibit a range of properties depending on the relative contents of the minerals combined. There may also be physical factors affecting separation machines. For instance, particle size can have a significant effect of separations. Turbulent flow may lessen the chances of attachment of small particles to an air bubble (the basis of flotation). This has to do with the environmental conditions in the machine rather than the intrinsic physical property of the mineral particle. For many reasons then minerals themselves have a distribution of values of any given physical property. And, a given fraction of mineral particles with the same value of a physical property will have a range of probabilities of reporting to a concentrate stream in a given process.
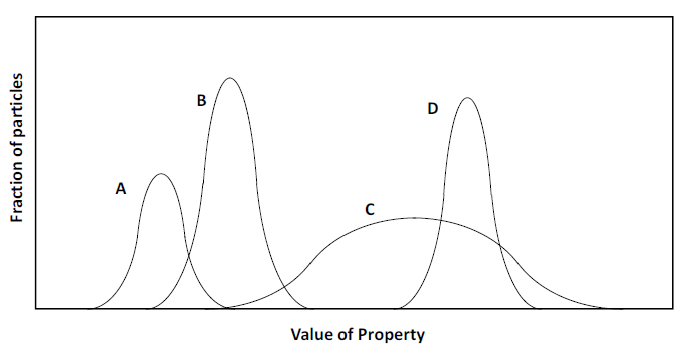
This range of properties poses challenges for separation processes. Consider Figure 6.1. The distribution of values of a physical property (e.g. density) is on the horizontal axis. The value of the property increases from left to right. The fraction of particles possessing a particular value of the property is on the vertical axis. Say a separation process (concentrator machine) can be set to select for all particles having the property above some specified value. Those with that the value of the property or greater are selected; those with lower values are rejected (ideally). Mineral D can be seen to be readily separable from minerals A and B. But C and D are not readily separable on the basis of this property. However, they might be using some other property.
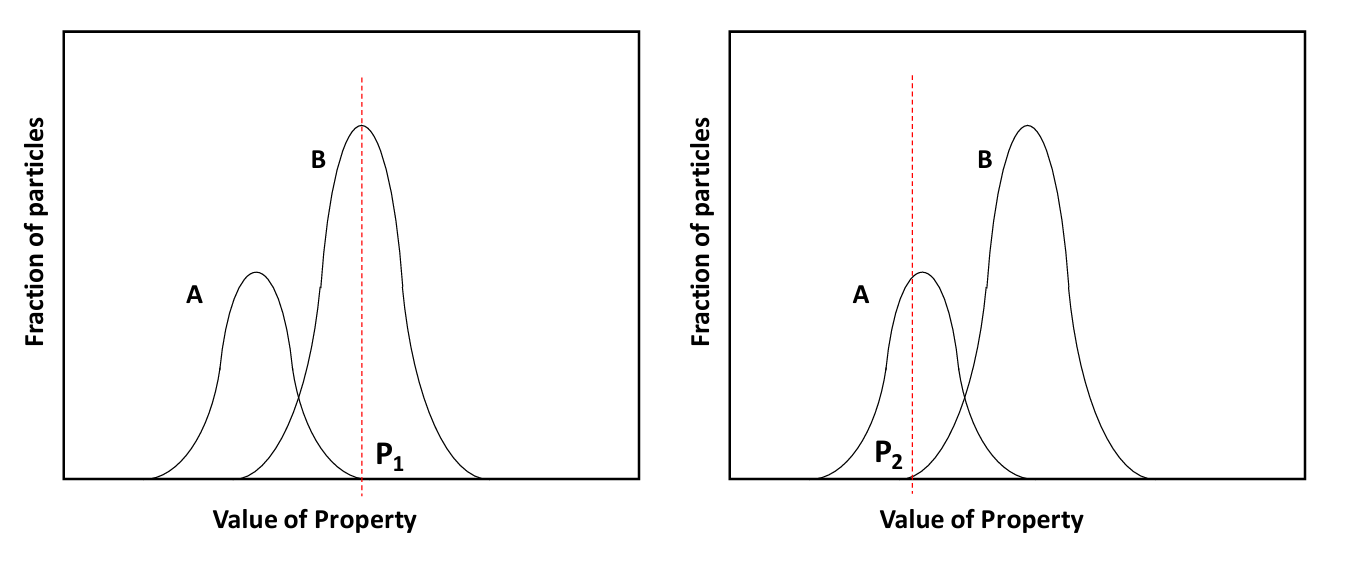
Suppose we have a simple ore with two minerals A and B as in Figure 6.2 (below) and we want to make a concentrate of B. Say the separation machine is set to select for all particles with the property greater than P1. This results in a concentrate of B with very little A in it. The grade of the concentrate would be high. But much of mineral B with values of the property less than P1 would be rejected and report to the tailings with A. The recovery would be poor. Next suppose we set the machine to a value of the property at P2. Now the great majority of B will report to the concentrate stream. But a significant amount of A also is selected and this lowers the grade of the concentrate. This illustrates an important limitation of mineral processing (and extractive metallurgy in general) - it is often the case that you cannot attain both good grade and good recovery of a mineral in a concentrate by means of a single process under a single set of conditions. Almost inevitably there will be a tradeoff between these two opposing goals. Grade and recovery can be improved or optimized by using different separating processes (using different physical properties) in series, or by using the same process in a series of steps, but under different conditions. The more complex the ore the more difficult this can be. And technical possibility may have to be tempered by economic limitations.
Recovery is defined as:
\[\text{Recovery}= \frac{\text{Mass of species of interest in product stream}}{\text{Mass of species of interest in feed stream}}\]
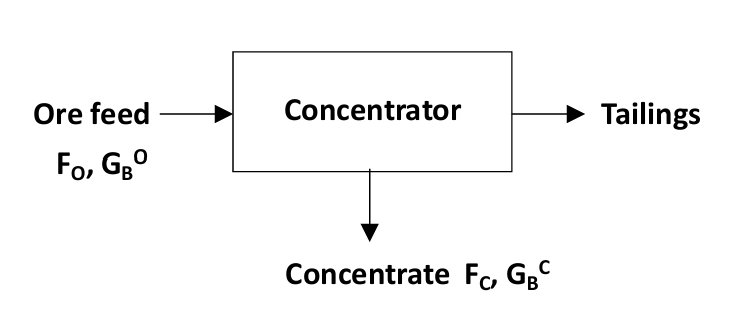
Consider a concentration process illustrated in Figure 6.2 (above). The recovery of the mineral of interest in the concentrate is:
\[R= \frac{F_C\ (\text{t/h}) \cdot G_B^C\ (\text{kg/t})}{F_O\ (\text{t/h}) \cdot G_B^O\ (\text{kg/t})}\tag{10}\]
where F refers to mass flow rate (e.g. FC = concentrate flow) and G refers to grades (e.g. GBC = grade of B in the concentrate). What this relates to is the ratio of the mass flow rate of a species of interest in a product stream to that in a feed stream. Usually this is expressed in %.
Selection on the Basis of Size
In principle selection on the basis of size can be done if minerals of interest have different sizes from the gangue. In practice this is not typically practical since size reduction processes will usually not result in mineral phases output with markedly differing size distributions. Of course discrimination on the basis of size is important for other reasons as noted previously.
Selection on the Basis of Density
The simplest density separation uses a medium (water, solution or slurry) of high density to effect separation. This is the float and sink method. Particles with higher density sink, while those with lower density float. Very fine material must first be removed, since it would settle too slowly. Typical feed sizes are 1.5 mm to 20 cm. Fluids used often consist of fine particle slurries. Examples are: Galena/water (slurry densities of 3.3-4.3 g/cm3; not common now - galena, i.e. PbS, abrades and oxidizes easily); magnetite (slurry density ∼2.5), and; ferrosilicon (slurry density of 2.5-4.0). Fluid medium particles are typically around 100 mesh (150 μm). The fluids are agitated to keep the media particles suspended and to lower the apparent viscosity (due to increased shear). Separation of mineral particles from those of the medium needs to be readily achieved, usually by washing, in order to allow recycling of the particles for the medium. Magnetic separation of magnetite and ferrosilicon is also possible. The separation may be enhanced by applying short, frequent pulsations. This accelerates sinking particles downwards briefly, then stops them and repeats the process. In principle separation is on the basis of density, not size. But hindered settling conditions apply in concentrated slurries, so larger particles may be impeded. A prior size selection may be required.
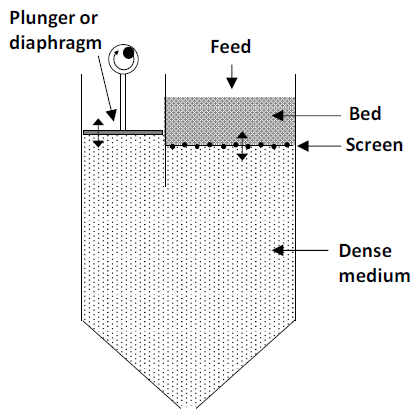
Jigs
A similar approach utilizes a device called a jig (Figure 6.4 below). This is illustrated atop the next page. Again a dense slurry medium is used. The mineral slurry is fed onto a screen. The medium is oscillated up and down through the screen. All particles are lifted from the screen in the upstroke. In the downstroke the denser particles fall back to the screen. Sufficiently fine (pass the screen) and dense particles descend through the screen to the bottom of the jig. The lighter particles at the top of the bed are removed. Particle fractions are removed using weirs (not shown). The heavier particles remaining on the screen may be tapped off.
Shaking Tables
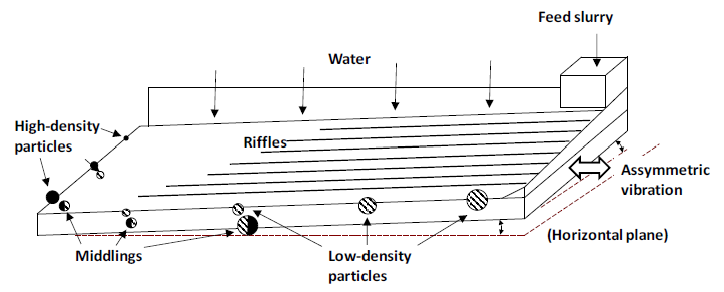
Shaking tables are another method devised to effect separations on the basis of density. They consist of a table at a low incline (up to 6°). The angle decreases as the distance from the feed source increases. The table is also riffled with parallel channels, the depth of which decrease with distance. Feed slurry is introduced at the top corner. As the slurry moves over the table the denser particles settle toward the bottom of the slurry while the lighter ones stay near the top. The table is vibrated laterally. The vibration may be asymmetric; slow forward and rapid backward, to move the particles down the table. Water near the surface is retarded by contact with the grooves. Water near the top of the slurry film moves more quickly and carries the lighter material with it. The effect is to cause separation of the coarse, light particles from the denser, smaller particles. A schematic illustration of a shaker table and the product distribution is shown in Figure 6.5 (below). An advantage is that they can handle finer feeds than jigs and the like. Slurry compositions of up to 25% by weight may be used. This sort of gravity concentration is especially good for concentrating fine gold particles.
Spiral Classifiers
There are several types of gravity concentrators, especially for gold. Another example is a spiral classifier. These use a descending helical trough. A slurry of mineral particles travels down the spiral. Wash water may be introduced at various points to push light particles up the side. Heavier, denser particles form a band that stays closer to the centre bottom of the trough. The lighter materials tend to spread up toward the edge. A middlings band forms in between. Exit ports are placed along the trough to collect the dense material. The steepness of the trough affects selectivity and capacity. Steeper spirals have greater capacity, but lower selectivity. Middlings may be collected from lower down in the spiral. Throughputs of 1-3 t/h are common. For a high tonnage feed many spiral classifiers in parallel are needed.
Centrifugal Concentrators
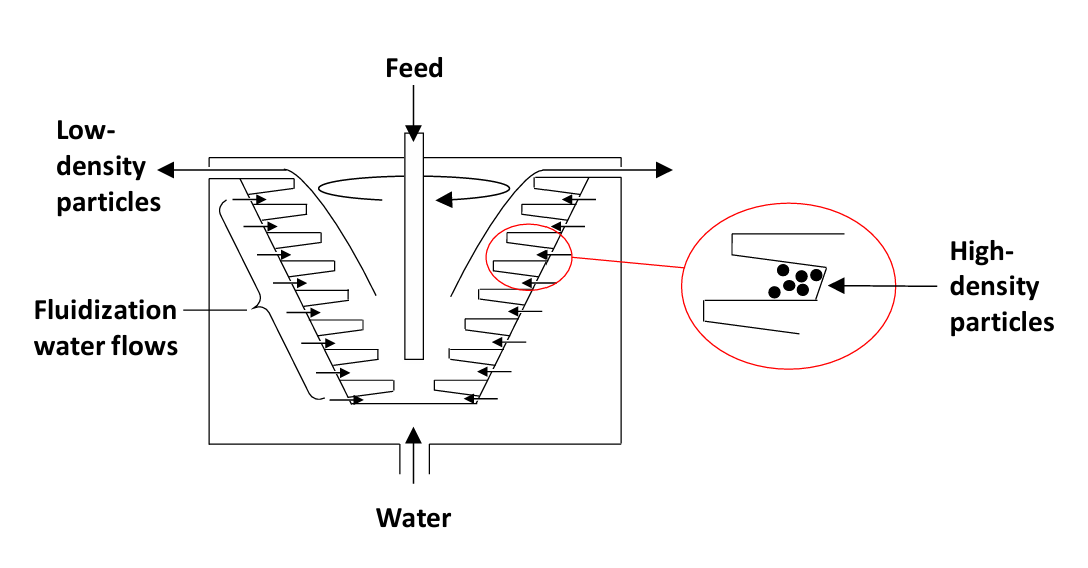
A more recent type of gravity concentrator uses centrifugal force to amplify the effect of gravity. The machine consists of an inverted cone with riffles projecting horizontally from the wall. Ore feed is introduced along with water to produce a fluidized bed. Dense particles get trapped in the riffles while low-density material overflows the top of the bowl. After a time the ore feed is stopped and the dense particles are flushed out of the riffles into a launder. The flushing/recovery process can take as little as a minute so the machines are essentially continuous. There is more than one type of these machines. Knelson Concentrators were pioneers in this area. These machines are heavily used in the gold mining industry to recover gravity concentrates of gold. Due to the centrifugal forces employed (up to about 60 G) even very fine gold particles can be recovered. A schematic illustration is shown in Figure 6.6 (below).
Magnetic Separators
These work on the principle that some materials are attracted to a magnetic field, while others are not (or are very weakly repelled). Magnetic separators have been in use for 200 years. Most materials are either diamagnetic or paramagnetic. Diamagnetic materials are very weakly repelled by a magnetic field. The paramagnetic ones are weakly attracted. Diamagnetic compounds have all their electrons paired. In paramagnetic compounds there are unpaired electrons. Paramagnetic attraction is weak, but diamagnetic repulsion is weaker still.
Furthermore, in a some materials the unpaired electrons interact strongly with each other (which is usually not the case in ordinary paramagnetic materials). In ferromagnetic materials the electron spins tend to align with each other. These then can interact much more strongly with a magnetic field than paramagnetic materials. In antiferromagnetic materials the spins of electrons on neighbouring atoms interact so as to pair off. There are still unpaired electrons on the individual atoms, but the net effect is for the material to be very weakly magnetizable because of this pairing. Ilmenite (FeTiO2) is an example. In ferrimagnetic materials the unpaired electrons again pair up with those of neighbouring atoms, but now the atoms which have the unpaired electrons are of different types; they are in chemically different environments. The material may be moderately attracted to a magnetic field, although potentially more strongly than an ordinary paramagnetic material. An example is Fe3O4, magnetite. Unpaired electrons reside on the iron atoms. Due to the way that the atoms are bonded in the crystal structure the iron atoms occur in two distinct chemical environments. Magnetite is moderately attracted to a magnetic field.
A magnetized particle may be thought of as a small magnet of length L (the particle diameter) with north (N )and south (S) poles. Inside a uniform magnetic field this little magnet experiences equal and opposite forces. The net force is zero. There is no attraction. If the particle is in a region of the field where there is a gradient, i.e. field strength varies significantly with distance, then the forces on the two ends differ and there is a net pull on the particle. Since most materials interact rather weakly with magnetic fields, a strong field is required. But a steep gradient is also necessary. These are somewhat conflicting requirements, since a strong field implies little change in field strength with distance. Hence both particle size, the field source and the distance between the source and the particles are key parameters in designing separators.
In addition, the strength of interaction depends critically on the amount of material. Hence a composite particle comprised of say a paramagnetic compound plus a diamagnetic one will be less strongly attracted than one which is composed purely of the paramagnetic compound. Likewise the purely diamagnetic particles will be more thoroughly rejected than the composite particles. This is an example of something that contributes to a distribution of values of a physical property used to effect separations as was described at the start of the section Particle Selection - Making Concentrates.
Magnetic separations may be performed on dry and wet feeds. Feeds necessarily move past the separator. Hence centrifugal forces will oppose the magnetic attraction. Gravity and drag forces also oppose magnetic attraction. For larger particles the effect of gravity is more important than drag; they are more massive. For small particles drag forces are more important than gravity, particularly in wet feeds. This is an example of how environmental conditions contribute to a distribution of extents of selection of particles in a separator as was described at the start of the section Particle Selection - Making Concentrates.
Ordinary compounds (e.g. oxides, halides, main group elements) of common metals/semimetals including Si(IV), Al(III), Mg(II), Ca(II), Na(I), K(I) and Ti(IV) are diamagnetic. Examples are SiO2, TiO2, Al2O3, MgCO3, BaCO3, etc. Many transition metal cations or formally cationic atoms in compounds are paramagnetic (not all). In natural rocks Fe(II), Fe(III) and Mn(II) are common and these states are paramagnetic, or in some cases more strongly magnetic, such as ferrimagnetic Fe3O4 and Fe1-xS (pyrrhotite). Other transition metal species which may exhibit paramagnetism include Cr(II), Cr(III), Mn(IV), Co(II), Co(III), Ni(II) and Cu(II). An illustration of relative attraction of compounds to magnetic fields is shown in Table 6.1 (below). Impurities in natural samples may also give rise to small magnetic moments.
| Table 6.1 - Relative attraction of some common minerals to a magnetic field compared to iron. (Iron is ferromagnetic.) | |
|---|---|
| Compound or mineral | Relative attraction to a magnetic field |
| iron | 100 (arbitrary) |
| magnetite, Fe3O4 | 40 |
| pyrrhotite, Fe1-xS | 7 |
| hematite, Fe2OO3O | 1.3 |
| pyrite, FeS2 | 0.2 |
| fluorite, CaF2 | 0.1 |
| calcite, CaCO3O | 0.0 |
Design Principles
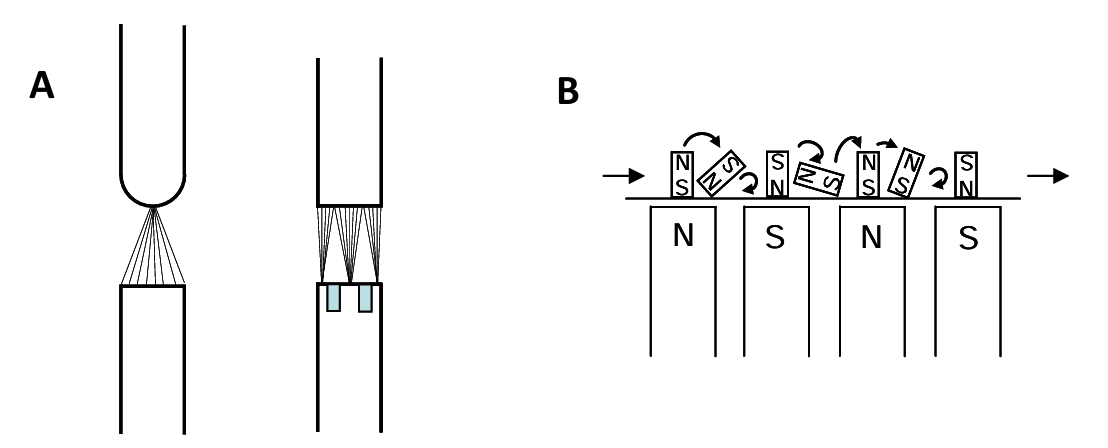
Achieving a magnetic field gradient can be done using various geometries of magnetic poles as shown in Figure 6.7 (A) (below). Field strength may be varied by use of electromagnets and by adjusting the gap between the poles. Feed should be presented to the separator ideally as a thin, spread out, uniform sized bed. Dry feeds are easier to process. Damp feeds may clump. High water-content slurries may be used. Dry feeds may be coarser. Wet feeds should be finely ground. Alternating N and S poles cause magnetic particles to tumble and this helps to free them from non-magnetic particles; see Figure 6.7 (B).
Low Intensity Separators
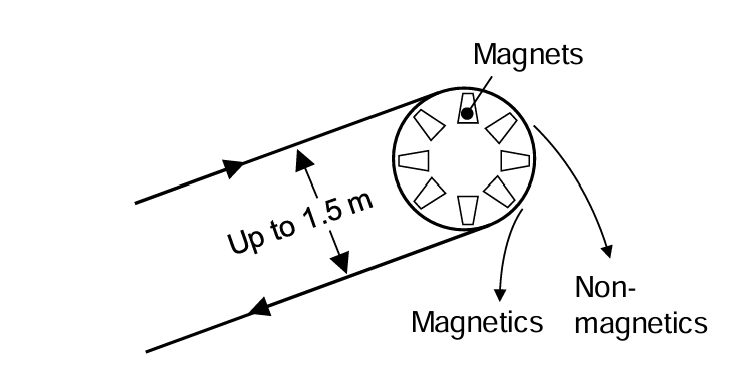
Some types involve belts moving over fixed magnets. The belts may move at up to 150 m/min. A schematic illustration is provided in Figure 6.9. These utilize dry feeds. Drum separators are another common type. In a dry magnetic drum separator (Figure 6.9 A) the feed enters cocurrent to the drum rotation. Three fractions may be obtained: tailings, concentrate (magnetic particles) and a middlings fraction. The latter is comprised of composite particles of magnetic and non-magnetic materials. If desired the middlings can be returned to grinding for further liberation. These types of separators provide high-grade concentrates, but significant losses of magnetic particles to the tailings occurs (poor recovery). With counter-rotating separators the feed enters in a direction counter to the drum rotation. These provide excellent recovery, but a lower grade concentrate; significant amounts of non-magentic particles enter the concentrate fraction. Series of counter-current separators can also be designed. This involves wet feeds. Tailings are moved in one direction and concentrate particles in the other.
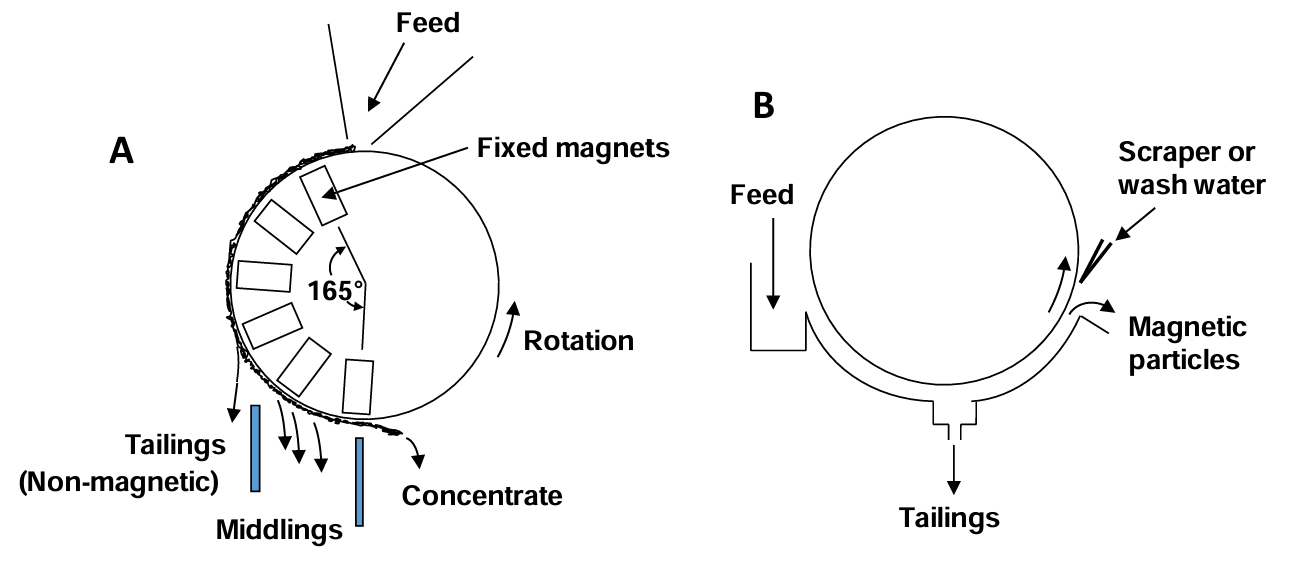
Wet separators may also use drums. An illustration of a co-current type is shown in Figure 6.9 (B) (above). The feed enters with the drum rotation. These are useful for larger particles (<6 mm). Counter-rotating separators have the feed enter from the opposite direction to drum rotation. These are more suited to smaller particles (<1.7 mm). Finally a series of separators operating in counter-current fashion are suited to recovery of very fine particles. Capacities for the three types range from 20-34 m3/h for the co-current separators to 11-16 m3/h for the counter-current separators.
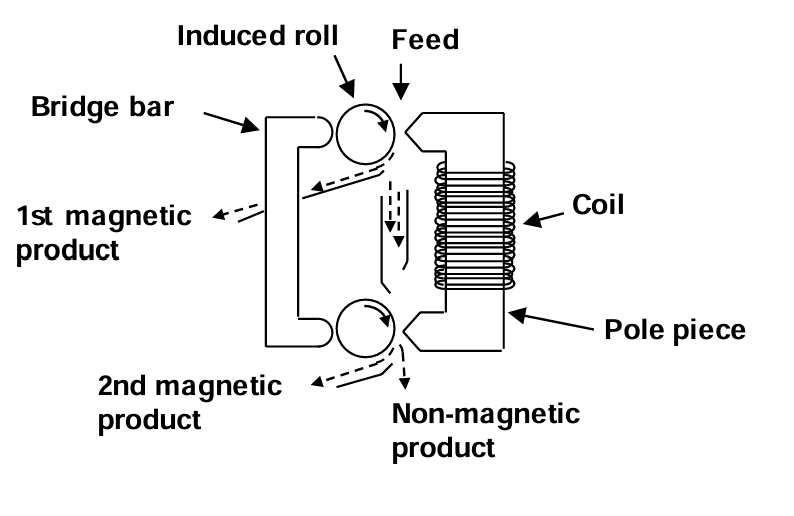
High Intensity Separators
An illustration of a high intensity separator is shown in Figure 6.10 (below). These use very high intensity fields. In this example the rolls have an induced magnetic field. Magnetic particles are drawn around with the roller and drop off as they leave the high intensity region of the field. In this case two magnetic products may be obtained. The non-magnetic particles are slightly repelled by the strong field. The gap between the pole and the rollers is adjustable, so the machine can be tuned to be selective to different magnetic materials. Other more complex separators also exist.
Electrostatic Separators
Separation can be made on the basis of forces acting on charged or polarized particles in an electric field. There are three main mechanisms by which a material may acquire a static charge. The first is contact electrification. When dissimilar materials are brought in contact, e.g. rubbed together, a charge separation occurs, and both materials become charged. Repeated contact builds up a static charge. This is hard to control in practice due to variation in properties of materials.
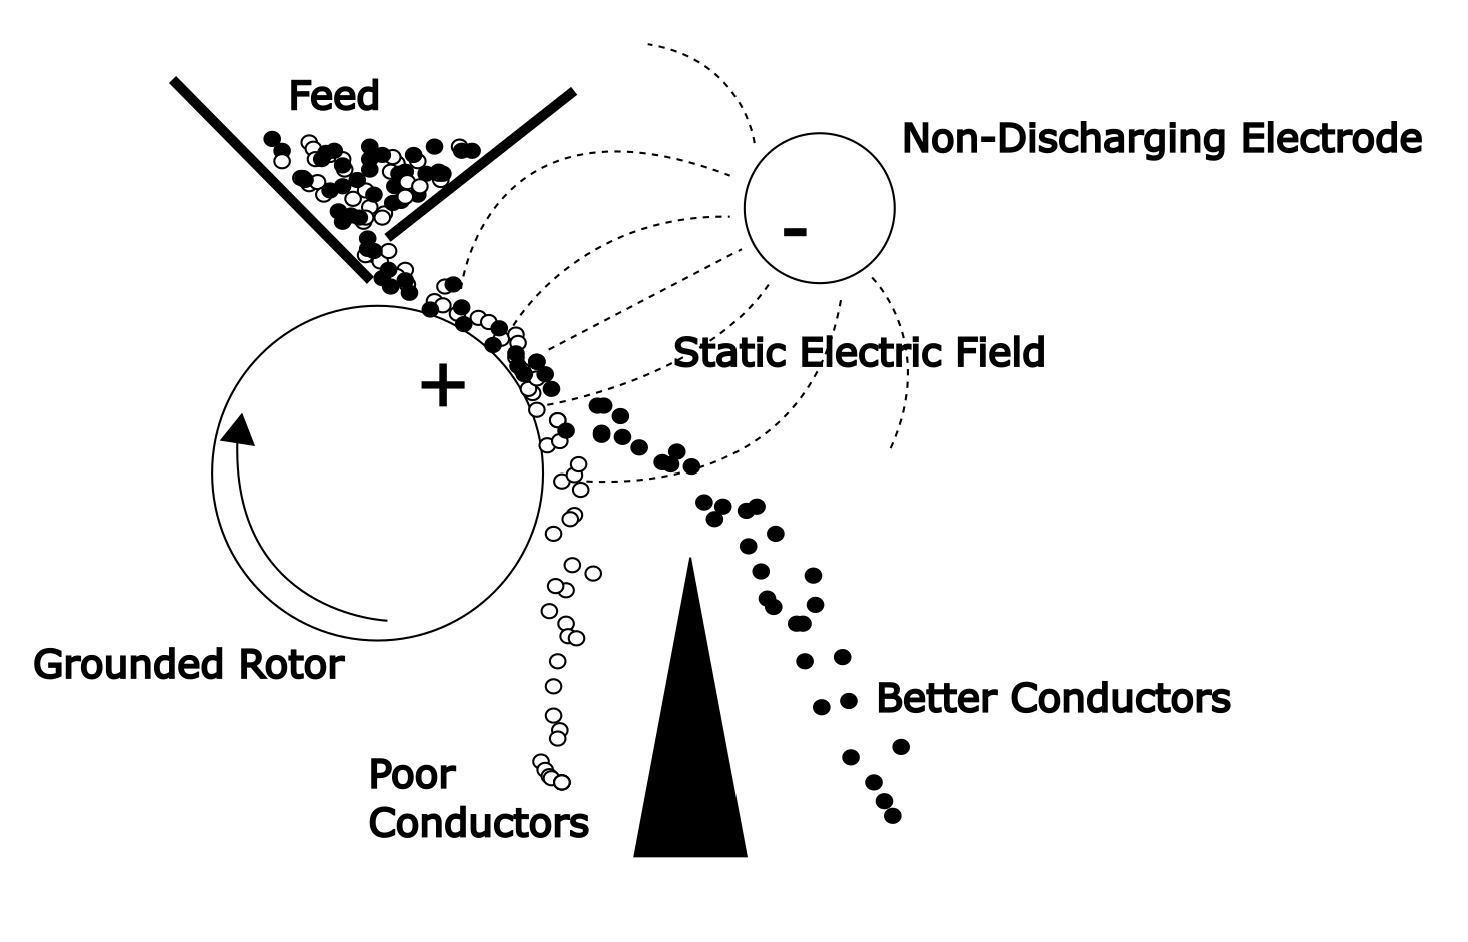
Conductive Induction
A second method is conductive induction. If a particle is placed on the surface of a grounded rotor in an electric field the surface of the particle will become charged by induction. An application of this is illustrated in the Figure 6.11 (below). Conductive particles rapidly acquire the ground potential of the rotor. These will be attracted to the opposite electrode. Non-conducting particles do not pick up charge from the rotor. These stay close to the rotor and then fall away as indicated in the figure. No electric current flows between the two electrodes in this type of separator.
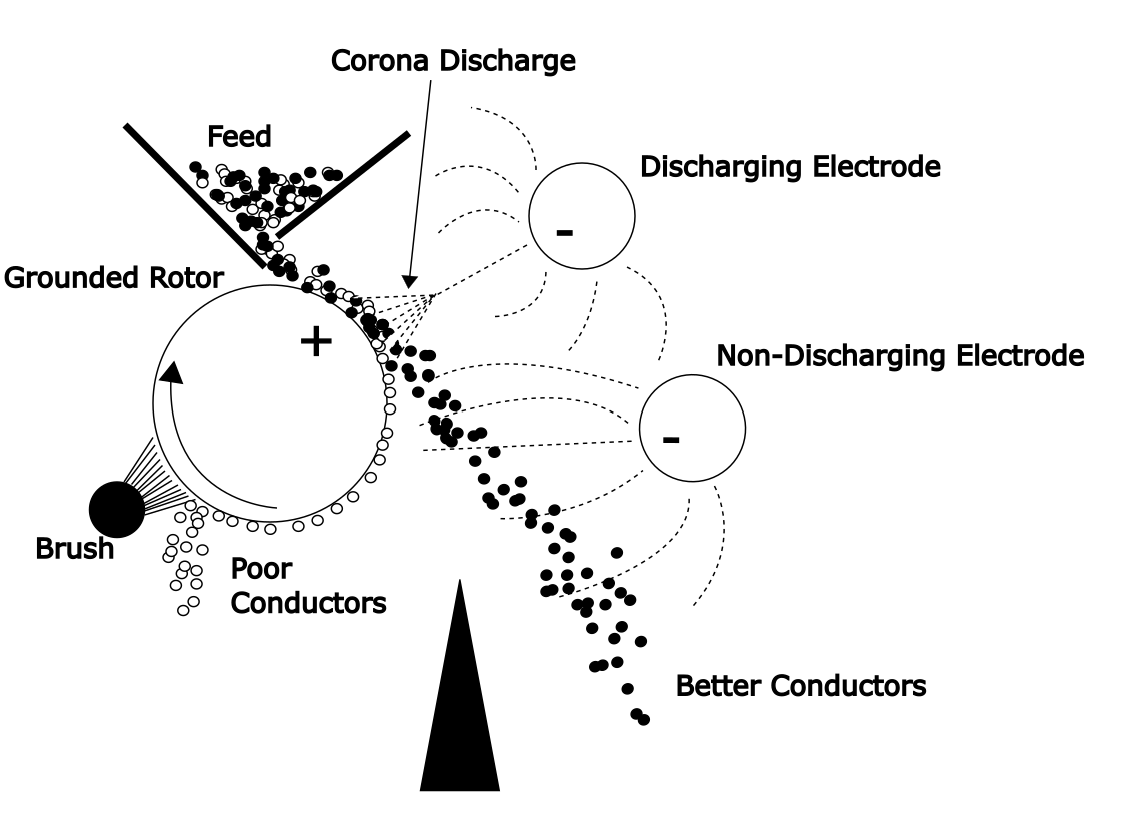
Ion Bombardment
These are also called electrodynamic or high tension separators. A very strong electric field will discharge and ionize the air between the two electrodes. These charged ions contact mineral particles as they flow past and the ions attach to the particles. The particles acquire a charge. Good conductors will lose their charge more rapidly than poor conductors. The poorly conducting particles are attracted to the rotor. The conducting particles tend to fall off the rotor, while the non-conducting particles stick with the rotor longer. This is illustrated in Figure 6.12 (below). In this case the discharging electrode provides the ion source and a non-discharging electrode further accentuates the separation by attracting the conductors to itself, as outlined above. A brush or scraper may be used to draw away the non-conducting particles from the drum. Arcing between the discharging and rotor electrodes short-circuits the system and defeats separation. A corona discharge is needed. This results from a high enough voltage to provide a faint glow at the discharging electrode, but not high enough to cause arcing.
It is critical that the feeds be dry. High humidity can cause problems with these separators. Pre-drying by heating may be necessary. The feed layer should also be thin, which limits capacity. Particle sizes of 50 - 500 μm can be separated. The charge acquired by the particles resides on the surface. Hence higher surface area-to-volume particles (finer) are more strongly attracted by the field. Larger particles are more readily thrown from the rotor. For the same reasons higher throughputs can be obtained with coarser particles. Less charge per unit mass is required, since again the surface area per unit volume is lower. In addition, larger particles trap a lesser degree of unwanted particles amongst them. Cleaner separations can be achieved. Commercial machines use long drums of up to 3 m by 15-35 cm diameter. Capacities are up to 1.5 t/hr per m of drum length.
Conductivities of materials vary greatly. Many pure metals have quite high electrical conductivities. Ionic solids have a fairly wide range of conductivities. Covalent solids (e.g. SiO2) have very low conductivities. Differences in conductivity are crucial to the success of electrostatic separators. Crystal structure defects and the presence of impurities can have a marked effect on the conductivity of a mineral. Conductivity can change by several orders of magnitude. Hence testing with actual samples is required before implementing this type of separation process. Resistivity is the inverse of conductivity. Low resistivity means high conductivity. Normal pyrite has a resistivity of 5 × 10⁻⁵ to 0.5 ohm m. In the extreme as low as 10-6 ohm m can be observed. A good metal conductor has a resistivity in the range 10-8–10-6 ohm m. Galena (PbS) has similar conductivity to pyrite. Pentlandite (Fe,Ni)9S8 has low resistivity (10-6–10-5 ohm m). Many common oxides have quite high resistivities (>0.01 ohm m). But some oxides have somewhat lower resistivities, e.g. magnetite, 0.001-0.01 ohm m and hematite, 0.007-0.02 ohm m. Some examples of electrostatic separations include:
- Separation of rutile (TiO2), ilmenite (FeTiO3) and zircon (ZrSiO4) from beach sands.
- Separation of tin ores from stream placers (alluvial or glacial deposits).
- Separation of scheelite (CaWO4) from pyrite.
- Concentration of specular (mirror-like) hematite.
A schematic diagram of an example flowsheet for treatment of beach sand is shown in Figure 6.13 (below). Both magnetic and electrostatic separation processes are employed.
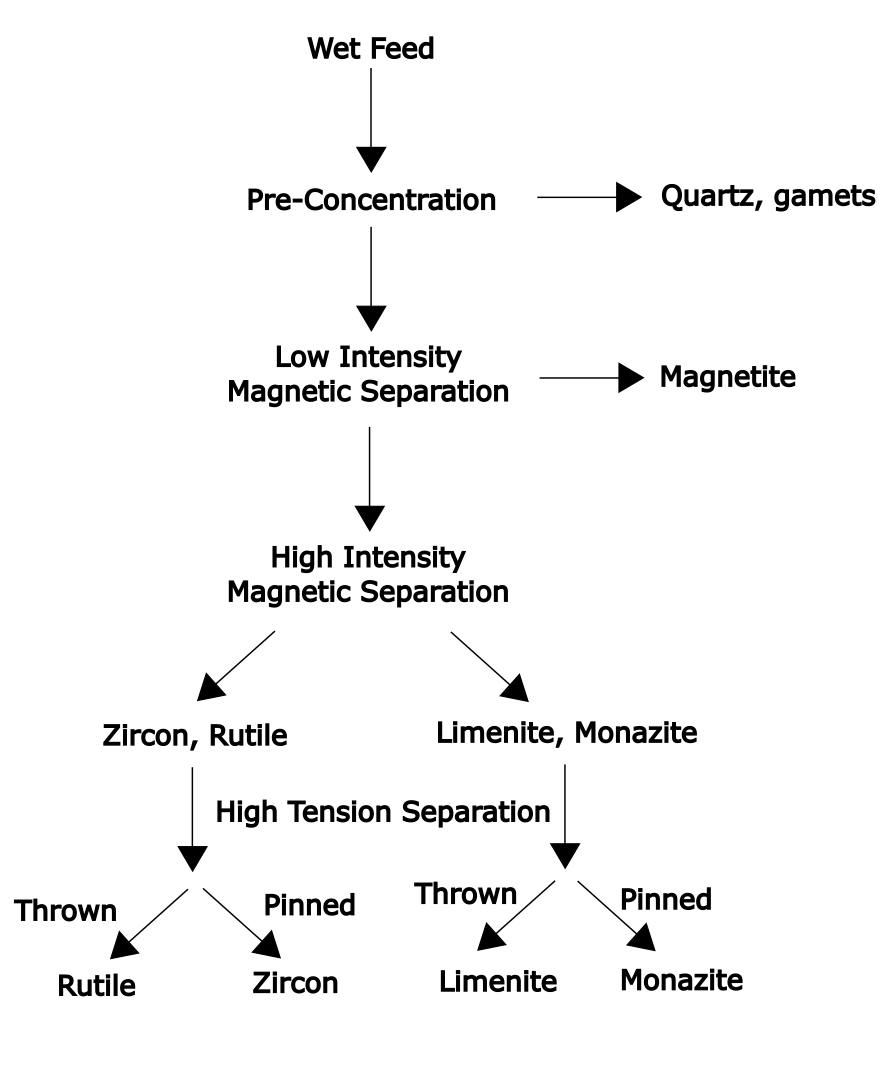
Gravity concentration removes much of the lighter minerals. This relatively simple procedure lowers the required throughput that subsequent, more costly separation processes must treat. A low intensity magnetic separator is used to recover the strongly magnetized Fe3O4 mineral. Now high intensity magnetic separation is used to separate paramagnetic minerals from diamagnetic minerals. These two fractions must then be dried prior to electrostatic separation. This finally separates out the four desired minerals: rutile (TiO2), zircon (for zirconium), ilmenite (for titanium) and monazite (A phosphate mineral that contains lanthanides). "Pinned" and "thrown" refer to which minerals are held by the separator and which are not, respectively.
Froth Flotation
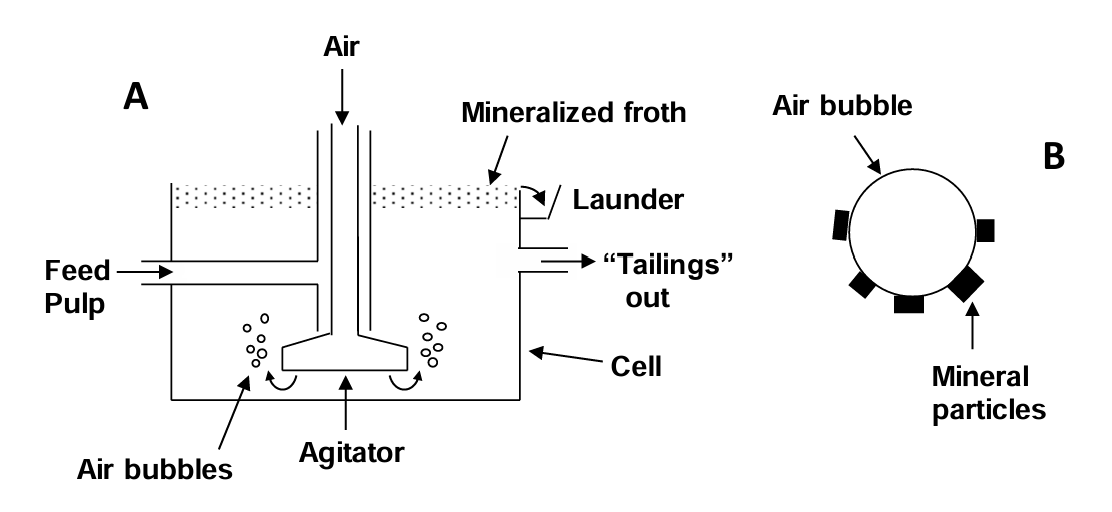
Flotation is selection on the basis of air displacing water from a mineral surface. This allows mineral particles to attach to air bubbles and be floated. This is the single most important and versatile mineral processing technique. It was first patented in 1906. It allows for processing of low-grade and complex orebodies not treatable by any other method. Flotation was originally developed to treat sulfide ores. It is now possible to treat oxide ores and ores produced for nonmetals, such as phosphates and fluorite (CaF2). Old tailings from very old operations have been treated with flotation to allow further recovery of valuable metals. With addition of suitable reagents, specific mineral particles in a slurry selectively attach to air bubbles and rise to the surface. At the surface a stable froth forms that is skimmed to collect the floated minerals. Particles that do not attach to bubbles flow out separately from flotation cells as the "tailings". Tailings may be further processed or disposed of. This is illustrated in Figure 6.14 (below). Direct flotation lifts the desired minerals away from the gangue. Indirect or reverse flotation lifts the gangue away from the desired minerals.
Mineral particles must be quite fine in order for air bubbles to lift them. Above all, the air bubble must be able to partially displace water from the mineral surface, or the particles won’t attach to the air bubbles. This means that the mineral surface needs to be hydrophobic, i.e. weakly interacting with water. The rule is:
- Hydrophobic particles float
- Hydrophilic particles don’t float
Most minerals are, in fact, hydrophilic and interact strongly with water. Therefore reagents are added that render the surface hydrophobic. This was the key to making flotation feasible. Once the bubble-particle agglomerates reach the surface they must form a stable froth, otherwise the bubbles will collapse and the minerals will fall back down into the cell.
The driving force for attachment of particles to a bubble is reduction of surface energy. This is manifested as surface tension. There are three interfaces formed when a particle attaches to a bubble. These are the air-solid interface (AS), the solid-water interface (SW) and the air-water interface (AW). In order for a stable air-solid interface to form there must be a net reduction in the surface energy. Surface tension forces act to minimize each of these interfacial areas. These forces may be represented diagrammatically as shown below. The surface tensions are represented by γ (N/m). At mechanical equilibrium the three forces are in balance. Consider a bubble as it approaches a surface (Figure 6.15 below).
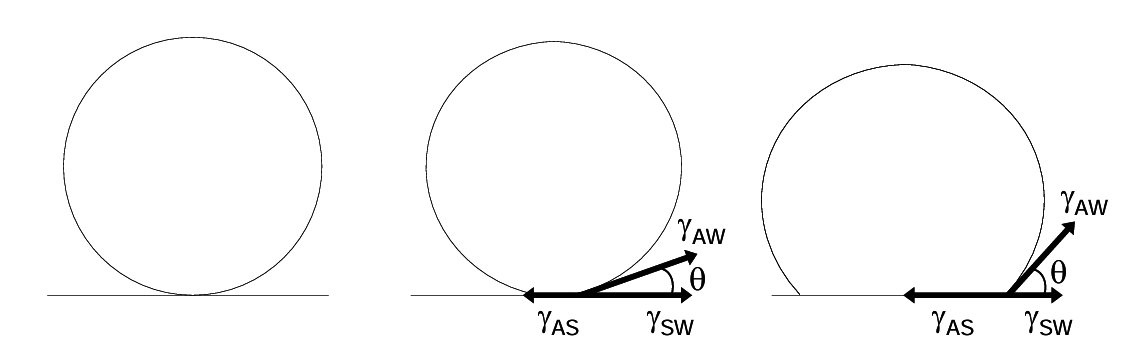
Where the three interfaces meet a three-way interface (circle) is formed. Here all three interfaces are in contact. As contact is initiated three forces act upon the three-way interface, which is the circumference of the bubble at the surface. Reduction in solid-water surface area pulls the interface outwards. This is resisted by the concomitant expansion of the air-solid interface (interfacial area spontaneously tends to decrease, not increase). The two forces are in direct opposition. Reduction in the air-water surface area can be achieved by pulling up on the bubble surface at the interface. This expands the air-solid interface while lowering the air-water interfacial area. This force is tangential to the bubble, at the interface. It has a component in the line of the other two forces, which is γAW cosθ. The air-solid interface continues to expand until the forces balance. At this point:
\[\gamma_{\text{AS}} = \gamma_{\text{SW}} + \gamma_{\text{AW}}\cos\theta\tag{11}\]
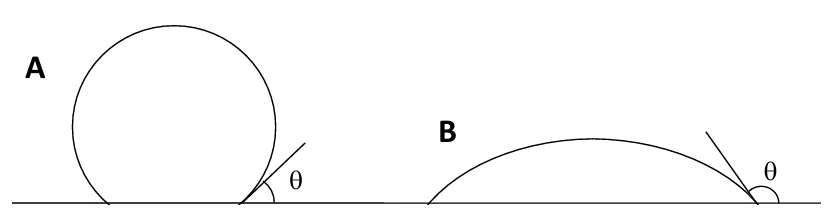
The angle θ is called the contact angle. If θ = 0 there is no contact. Under these conditions the surface is perfectly wetted; it is highly hydrophilic. If θ is large there is a strong air-surface interaction (or more properly a relatively weak surface-water interaction). Now the surface is hydrophobic and the bubble attaches (Figure 6.16 below). The contact angle θ is a measure of how strongly a bubble attaches to a surface, and a measure of how hydrophobic a surface is. The most strongly hydrophobic materials (e.g. paraffin) have contact angles of about 110°. (Some plant surfaces are very hydrophobic).
The energy decrease due to formation of the particle-bubble interface can be calculated. Energy expressed in units of J = Nm. The energy per unit area is Nm/m2 = N/m. Hence the surface tensions are numerically equivalent to the surface energy per unit area. The energy change upon detachment is:
\[
W_{\text{AS}}
= \gamma_{\text{AW}} + \gamma_{\text{SW}} - \gamma_{\text{SA}}
= \gamma_{\text{AW}} + \gamma_{\text{SW}} - \gamma_{\text{SW}} + \gamma_{\text{AW}}\cos\theta
= \gamma_{\text{AW}}(1 - \cos\theta)
\tag{12}\]
The larger θ is, the larger is 1 - Cosθ and hence the larger is WAS. Again, the larger θ, the more readily the mineral will be floated.
A few minerals are naturally moderately hydrophobic: graphite, sulfur, molybdenite (MoS2), diamond and coal. For these ranges from 60-90°. Even in these cases reagents are added to increase the flotability. Most minerals are hydrophilic. They have polar surfaces that interact strongly with water. Minerals are classified by their polarity. This is shown in Table 6.2. Sulfides are weakly polar because of principally covalent bonding. Sulfates (having SO42- groups), carbonates (having CO32- groups), and phosphates (having PO43- groups) are more ionic and hence more polar. Group 3a is distinguished from group 3b because minerals in group 3a may be rendered more hydrophobic by treatment with a sulfide source (e.g. Na2S) in alkaline solution. This converts the surface mineral compound into a sulfide (like group 1). Small amounts of reagent are needed since only the surface needs to be transformed. (Sulfide minerals, as will be seen later are easier to float.) Oxides, hydroxides and silicates are quite polar (although not necessarily very ionic).
| Table 6.2 - Classification of minerals by polarity. | ||||
|---|---|---|---|---|
| Group 1 | Group 2 | Group 3a | Group 4 | Group 5 |
| Galena | Barite | Cerrusite | Hematite | Zircon |
| Covellite | Anhydrite | Malacite | Magnetite | Willmenite |
| Bornite | Gypsum | Azurite | Goethite | Hemimorphite |
| Chalcocite | Anglesite | Wulfenite | Chromite | Beryl |
| Stibnite | (Mainly sulfates) | (Carbonates) | Ilmenite | Feldspar |
| Argentite | Corundum | Sillmanite | ||
| Bismuthinite | Group 3b | Pyrolusite | Garnet | |
| Millerite | Fluorite | Limonite | Quartz | |
| Cobaltite | Calcite | Borax | (Silcates) | |
| Arsenopyrite | Witherite | Wolframite | ||
| Pyrite | Magnesite | Columbite | ||
| Sphalerite | Dolomite | Tantalite | ||
| Orpument | Apatite | Rutile | ||
| Pentlandite | Scheelite | Cassiterite | ||
| Realgar | Smithsonite | (Oxides/hydroxides) | ||
| Native Au, Pt, Ag, Cu | Rhodocrosite | |||
| (Mostly sulfides) | Siderite | |||
| Monazite | ||||
| (Mainly carbonates, phosphates, some others) | ||||
Flotation requires a careful balance of many chemical and physical factors. These include:
- Particle size (e.g. larger, more massive particles are more difficult to float).
- pH (affects several factors).
- Electrochemical potential (oxygen oxidation of freshly exposed mineral grains of sulfide minerals chemically alters the surface and may make it unfloatable).
- Adsorption (of added reagents to render the surface hydrophobic).
- Surface chemical reactions (to modify the surface hydrophobicity).
- Bubble attachment to the mineral.
- Froth formation.
- Floating of bubble-mineral aggregates against gravity.
- Fluid viscosity.
When mineral particles are liberated from host rock much breakage occurs. This exposes fresh surfaces where chemical bonds have been broken. These surfaces have relatively high energy. They may involve charge imbalances as well. Water is a polar molecule with a dipole. The oxygen end is somewhat negatively charged; the hydrogens somewhat positively charged. Partial neutralization of surface charge can occur by adsorption of water onto the surface. In addition water molecules may chemically bond with some of the exposed metal atoms at the surface, also lowering the surface energy. Ions and molecules in solution may also adsorb to the surface. This in part is why pH is so very important; pH determines which forms of acids or bases are predominant and affects adsorption equilibria. Gravity and turbulent motion of the fluid around the bubble-particle aggregate act against flotation. Particle size is a critical factor. Cassiterite (SnO2) is a source of tin. It can be recovered by flotation. Note that there is an optimum particle size. Very fine material is not floated. This may be due in part to fine, hydrophilic slimes coating the mineral particles and/or small particles being unable to attach to air bubbles due to turbulence. Flotation characteristics depend on the source of the mineral and testing is required for any new orebody.
Collectors
Collectors are chemical compounds added to slurries to modify surface properties. Most collectors are comprised of molecules having a highly polar end and a non-polar end (heteropolar). These are part of a general class of compounds called surfactants (short for surface active agents). Due to their heteropolar nature surfactants are particularly active at interfaces. The polar part of a collector molecule adsorbs to the mineral surface and a layer of non-polar ends extends into the solution. This non-polar layer is hydrophobic and renders the mineral particle flotable. Sodium ethylxanthate (NaS2OC2H5) is an example of a collector:
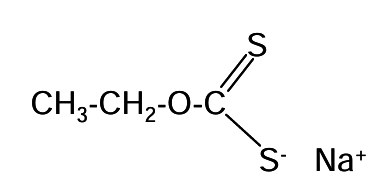
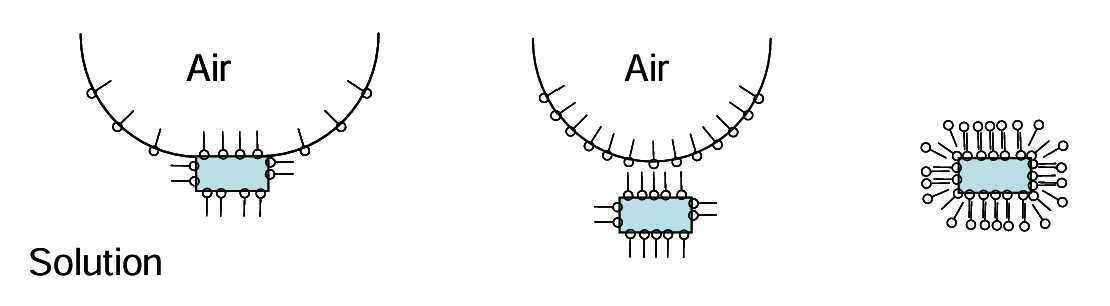
The CH3-CH2- portion is the non-polar end. The -O-CS2- (xanthate) end is polar. Once enough of the collector is adsorbed the mineral is flotable. The process is illustrated in Figure 6.18 (below). Exposed, positively charged sites on the mineral surface (from particle breakage) attract the negatively charged ends of collector molecules. The hydrated counterions in this case are Na+. At low concentrations only a small surface concentration of collector molecules adsorbs. As concentration is increased a hemi-micelle is formed. This presents a non-polar surface. Generally, the greater the concentration of the collector, the more likely it is that the mineral will be floated.
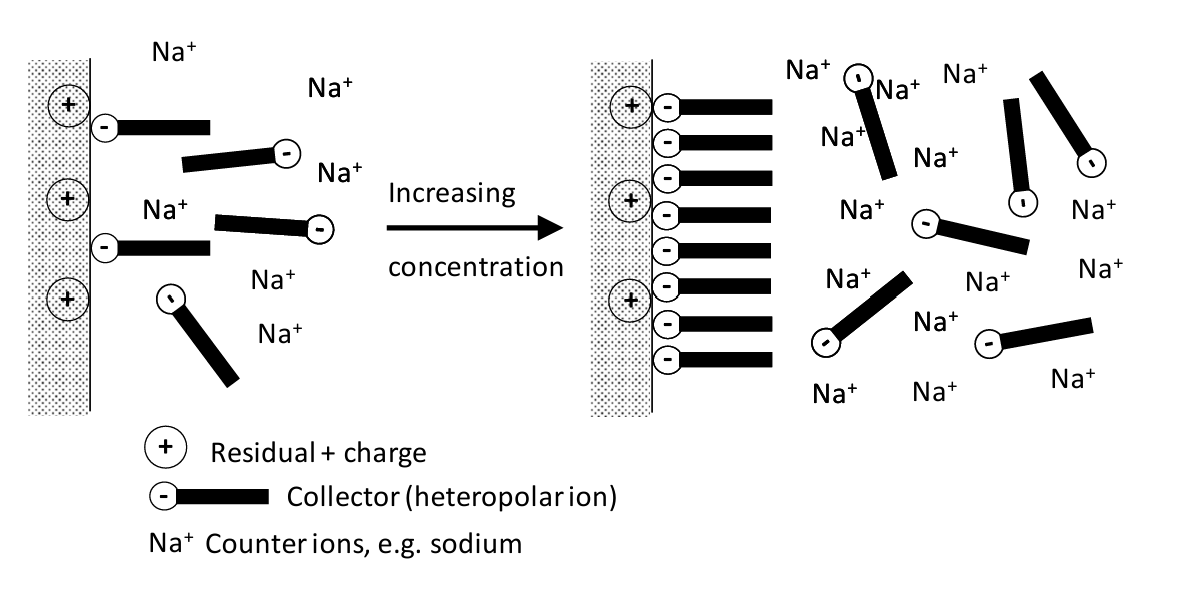
However, addition of too much collector will inhibit flotation. Non-polar ends of additional collector start to adsorb more and more to the air bubble (air is hydrophobic). The air bubble surface facing the water can become polar and separate from the particle. Even higher addition of collector results in hydrophobic ends of added collector adsorb to the mineral-bound collector layer; “like attracts like.” Now a polar layer begins to be presented to the solution. This attracts water rather than the air bubble. The ideas are further illustrated in Figure 6.19 (below).
Note that if the collector has weak acid-base properties (as does sodium ethylxanthate and many other collectors), pH critically affects the extent of ionization of the collector and hence its absorption properties.
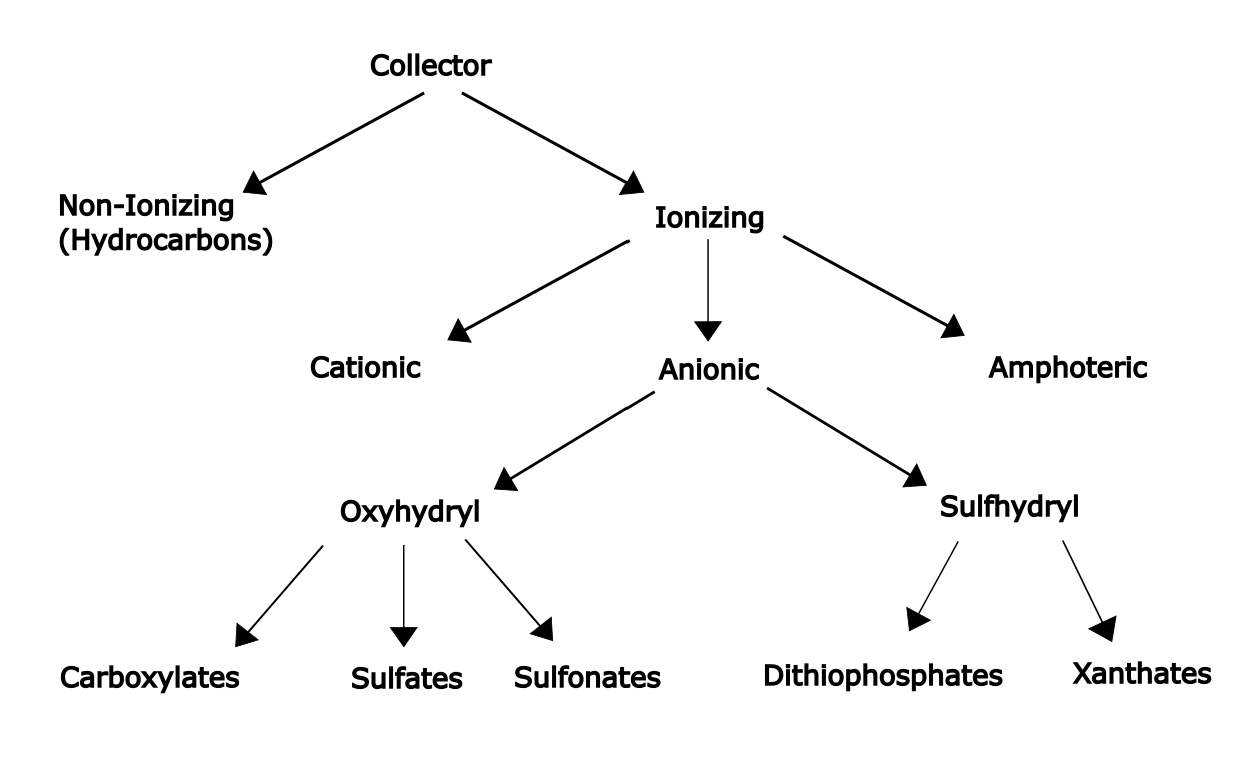
A classification of the more common collector types is shown in Figure 6.17. Ionic collectors are the most commonly used, and of these the anionic ones are the most frequently employed. Then the adsorbed species is an anion. Anionic collectors are subdivided into two groups: sulfhydryl (having divalent sulfur groups) and oxyhydryl (based on organic acids with anionic oxygen atoms). Common cationic collectors are based on quaternary ammonium compounds, either protonated amines or alkylated amines. Non-ionizing collectors have limited use for some specific applications. Numerous other collectors have been developed. This chart lists some of the common types only. Long hydrocarbon chains provide greater hydrophobicity, but increasing chain length also decreases water solubility of the collector itself. Typical chain lengths are 2-5 carbon atoms. Branched hydrocarbon chains may be more soluble. Generally, sodium salts are the more soluble form of anionic collectors.
Carboxylates (with -CO2- groups) are strong, but non-selective collectors. These are commonly used for magnesium, calcium, barium, and strontium minerals (e.g. carbonates of non-ferrous metals). Sulfate and sulfonate collectors are less commonly used. They are weaker, but more selective. These may be used with barite, celestite, fluorite, apatite, chromite, kyanite, mica, cassiterite and scheelite (these are mainly group 3b and group 4 minerals).
Sulfhydryl collectors are the most common. They are used especially with sulfide minerals, with which they interact strongly. They may be quite selective (discriminating between different minerals). Mercaptans (R-S-Na+, where R is an alkyl group) may be used for more difficult to float cases (refractory is the term used to describe this). The most common types are xanthates and dithiophosphates. The mechanisms of adsorption are complex. Xanthates of copper, lead, silver and mercury are quite insoluble in water. Those of zinc and iron are somewhat more water soluble. Hence ethylxanthate is a poor collector for sphalerite (ZnS), barring other chemicals to facilitate its use. Aluminosilicates, oxides, and silicates do not exhibit any collector action with xanthates. These are often what comprise much of the gangue minerals. Hence good separations of sulfides from these minerals can be attained. Typical operating pH range is 8-13. Concentrations required range from 5-100 g/tonne of ore.
Xanthates degrade over time due to reactions with oxygen from air. They also may be prone to hydrolysis (degradation by water) depending on pH. This leads to discolouration and to unpleasant odours. The degradation products may act as collectors, but with far different properties than originally intended. Finally, solubilized metal ions from ore (e.g. Pb+2, Cu+2 etc.) can precipitate with xanthates, lowering their concentration in solution and availability for flotation.
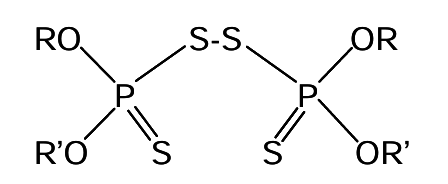
The dithiophosphates are less commonly used than xanthates. They are weaker collectors. Common operating pH is from 4 to 12. These are selective for copper and zinc sulfides. They may be used in combination with xanthates. The mechanism of how these collectors function may involve oxidation by oxygen to form disulfide linkages, i.e.
Cationic collectors tend to adsorb by electrostatic attraction. The interaction is relatively weak, so these are fairly weak collectors. They tend to be quite pH-sensitive, due in part to competition from proton adsorption on mineral surfaces. They are best suited to weakly acidic pH. They are inactive in basic solution and strongly acidic solution. They may be used for flotation of oxides, carbonates, silicates and alkaline earth minerals. Some other collectors are indicated in Table 6.3 (below). There are a great many collectors.
| Table 6.3 - Other collectors and some operating parameters. | |
|---|---|
| Name | Parameters |
| Dialkyldithiocarbamates | Operating pH 5-12. Similar to xanthates, but more costly. |
| Isopropylthionocarbamate | Operating pH 4-9. Good for separation of copper sulfides from pyrite. |
| Mercaptobenzthiazole | Operating pH 4-9. For flotation of surfaceoxidized or tarnished lead and copper minerals. |
Effect of pH
pH has several effects on collectors and thence flotation. Adsorption is a competitive process. Species other than the collector may also adsorb. This is illustrated in Figure 6.22 (below). Adsorption processes are chemical reactions with equilibrium constants (see the reaction below). Concentrations of adsorbed species are indicated in mol/m2 or like units, instead of amount/volume. At higher pH OH- is predominantly adsorbed over H+ and vice versa. As seen in
![Diagram illustrating adsorption equilibria and surface interactions in mineral processing. Top: general equilibrium between a positively charged mineral site and a negatively charged aqueous species, with equilibrium constant K = [(+O⁻)ₐdₛ] / [(O⁻)ₐq]. Bottom: specific reactions showing adsorption of OH⁻, H₂O, and H⁺ onto the mineral surface. Labels include anionic collector and adventitious surfactant.](https://pressbooks.bccampus.ca/hydrometallurgy/wp-content/uploads/sites/1991/2025/10/Ch2_F48_Adsorption_Equilibria.png)
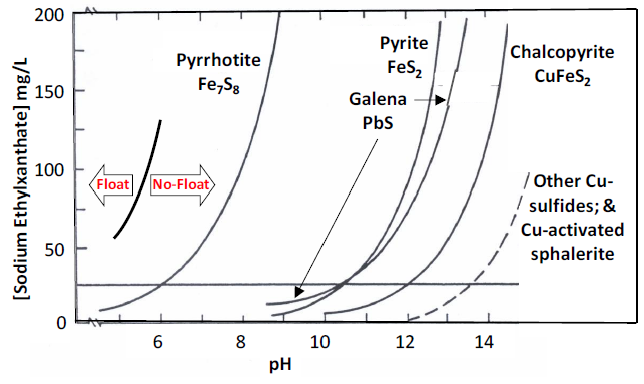
Figure 6.22 (above) numerous species may be involved in competitive adsorption equilibria. Some may be adventitious (unintentional - collector or other reagent decomposition products, humic acids from soil etc.). As shown in the figure hydroxide can displace adsorbed collectors from a mineral surface. Hence pH has a significant effect on collector adsorption. If the pH increases too much the concentration of OH- will become high enough to prevent collector adsorption to a great enough extent that a mineral will not float anymore. The pH at which this occurs depends on the collector concentration (as that increases higher [OH-] will be needed to displace it from the surface) and the strength of the collector-mineral interaction (K in the reaction above; the higher K is the higher the concentration of OH- will have to be to displace collector). Hence pH control in flotation is critically important. This in turn allows for selectivity in flotation of minerals. Plots of collector concentration versus pH where flotation ceases are called critical pH curves. An example is shown in Figure 6.23 (below) for ethylxanthate as the collector. For a given mineral flotation occurs only to the left of the curve. To the right of the curve the concentration of OH has gotten high enough to displace the collector; this is the no-float condition. If an ore contains the sulfide minerals chalcopyrite and pyrite and the concentration of sodium ethylxanthate is 25 mg/L, chalcopyrite can be floated below pH 12. Above pH 10.4, pyrite does not float. So to separate chalcopyrite from pyrite at this collector concentration 10.4 < pH < 12 is required.
The main pH control reagents are lime (CaO) and soda ash (Na2CO3). Both are weak bases, but lime is cheaper and slightly more strongly basic. Carbonate at higher pH offers the possibility of weak buffering with easier pH control. (Lime and hydrated lime are somewhat slow acting because they are sparingly soluble.) To achieve pH above about 12 NaOH is needed, which is expensive and higher concentrations of NaOH would also use up higher amounts of the reagent.
Basic pH also has other functions:
- Precipitation of some metal ions, e.g. Cu+2, Pb+2. These may interfere with flotation of some minerals a variety of ways.
- Minimize hydrolysis of the collector that occurs more rapidly at lower pH.
- Reduce corrosion due to acid mine water (which may arise from adventitious oxidation of sulfides.)
Therefore base may be added at the earliest possible point in the grinding circuit before flotation.
Frothers
These are added to the slurry to be treated by flotation to stabilize the mineralized froth and keep the bubbles from bursting prematurely. Ideally they should interact only with the water-bubble interface. In reality, some interaction with the mineral particles and other added chemicals also occurs. Hence careful test work is required. Again heteropolar molecules are used. These are strong surfactants that interact strongly with the air-water interface. Frothers must produce bubbles that are temporarily strong enough to be skimmed from the surface of a cell. If the bubbles are too well stabilized then it becomes difficult to break up the froth after it leaves the flotation cells and collect the mineral particles; large volumes of froth would result. Typical dosages are 15-100 g/tonne of ore. Common frothers include carboxylic acids, amines and alcohols. Alcohols are especially common since they have minimal collector properties. Alcohols give a more brittle froth. Polyglycols (having -C(OH)-C(OH)- groups) form quite strong froths. The choice depends in part on the particle size. Coarse, heavier particles may require a stronger froth.
Modifiers (or Regulators)
These are chemicals used to modify the strength of the collector-particle interaction. They may be used to enhance selectivity, even to float minerals that otherwise would not be flotable. There are three main types: activators, depressants and pH modifiers (these were mostly dealt with in the preceding section).
1. Activators
Typically these are ionic salts. These modify a mineral surface to improve the interaction of the collector with the mineral. An example is sphalerite flotation with xanthates. Zinc reacts well enough with xanthates, but water soluble compounds are formed. Hence the mineral does not adsorb enough reagent and does not get floated. Copper sulfate activates sphalerite such that ethylxanthate can adsorb on the surface and cause sphalerite to float. The mechanism is debatable, but one thought is that Cu+2 reacts with the ZnS at the surface to form CuS:
\[
\ce{ZnS_{surface} + Cu^{2+}_{aq} -> CuS_{surface} + Zn^{2+}_{aq}}
\tag{13}\]
Thus a thin surface layer of CuS forms. CuS is much less soluble than ZnS. The respective Ksp values are 8 x10-37 and 3x10-23. Copper xanthates are insoluble and now the surface of the ZnS particle can attach collector molecules. The amount of copper needed is small since only the surface needs to be modified. This adds only a miniscule degree of contamination to the ZnS. An application of CuSO4 addition is to aid in separation of a mixture of galena and sphalerite. Galena (PbS) is first floated selectively from the mixture. Then CuSO4·5H2O is added to facilitate ZnS flotation in a second stage. Copper sulfate also has a moderate activating effect on PbS, pyrite and calcite.
Sulfide (as NaSH or Na2S) may act as an activator in some cases. This works for oxidized minerals of Pb, Cu and Zn, which form quite stable sulfides (low Ksp values). The sulfides are generally less soluble than the oxides/hydroxides. An illustrative example is activation of cerussite, PbCO3. (This is a group 3a mineral from Table 6.2.) Addition of Na2S raises the pH by hydrolysis reactions. This in turn converts some of the surface PbCO3 into a plumbate. This reacts with sulfide to form PbS. The reactions are summarized below.
\[
\ce{Na2S + H2O <=> NaSH + NaOH}
\tag{14}\]
\[
\ce{NaSH + H2O <=> H2S + NaOH}
\tag{15}\]
\[
\ce{PbCO3 + 3NaOH -> NaHPbO2 + H2O + Na2CO3}
\tag{16}\]
\[
\ce{NaHPbO2 + NaSH -> PbS + 2NaOH}
\tag{17}\]
High concentrations of sulfide may be needed due to the relatively high solubility of the oxidized minerals. This solubilized mineral must first be re-precipitated.
2. Depressants
These make some minerals hydrophilic and act to inhibit flotation (not necessarily completely prevent it, but make it more difficult). There are many types of depressants and the mechanisms of their effects are not always well understood. The effects may also be hard to control.
Sulfide often acts as a depressant, particularly toward sulfide minerals. (Hence too much sulfide in the previous example would be deleterious.) On sulfide minerals, S2- or HS- ions may adsorb, causing an excess of negative surface charge on the surface. This may prevent anionic collectors from adsorbing. Sulfide adsorption competes with collector adsorption analogous to hydroxide.
Sulfide is also readily oxidized by oxygen. This is present in water solutions at low concentration (0.26 mM at 25°C from air). It turns out that some oxygen is required for sulfhydryl collectors to work effectively. Too much depletion of oxygen inhibits collector function.
Slimes (very fine ore particles produced during grinding) can coat larger mineral particles and present a hydrophilic surface that inhibits collector function. Desliming is sometimes necessary prior to flotation. This can be achieved by vigorous slurry agitation, or by addition of a desliming agent. Sodium silicate (Na2SiO3) disperses slimes by selectively adsorbing to their surfaces. The negatively charged surfaces now repel each other and don’t stick together. In this respect the silicate is acting as an activator. The depressant function of slimes is not desirable. Sodium silicate can also acts as a depressant toward non-sulfide minerals. This can be beneficial for selective flotation of sulfide minerals.
Cyanide as NaCN is an important depressant. It suppresses flotation of ZnS, FeS2 and some copper sulfides. In a mixture of sphalerite and some copper minerals, a little of the copper can adventitiously dissolve (leach) and unintentionally activate ZnS. Addition of NaCN complexes copper as [Cu(CN)x](x-1)-; x = 1-4. This prevents copper activation of sphalerite and prevents its flotation. Cyanide use requires a fairly alkaline pH (>9-10). In addition some metal xanthates dissolve in cyanide solution, which prevents flotation. Zinc, nickel, gold and iron xanthates (formed on surfaces) are soluble in cyanide solution. But the xanthate formed on PbS is not soluble; cyanide has little effect on xanthate flotation of galena. Therefore, PbS can be selectively floated away from the several other sulfide minerals after addition of cyanide. Cyanide does not tend to affect the mineral surfaces all that much, so subsequent activation is straightforward. Cyanide may chemically react with some activators, which can cause interference.
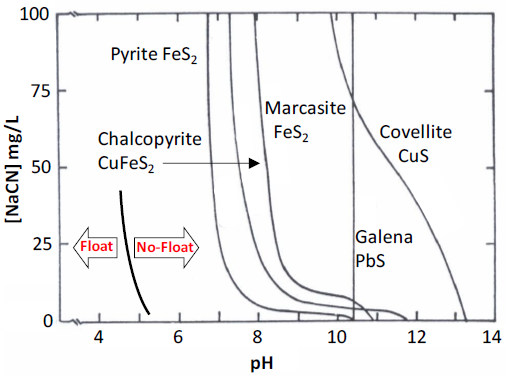
An illustration of the effects of cyanide on flotation of sulfide minerals is shown in the critical pH curves of Figure 6.25. Here it is the cyanide concentration that is plotted on the vertical axis for a set collector concentration of 25 mg/L sodium ethylxanthate (corresponds to the horizontal line in Figure 6.24). Most of the curves are shifted to significantly lower pH (left) at quite low concentrations of NaCN compared to curves in the absence of cyanide (Figure 6.24). This shifts the "no float" condition to lower pH. Note that galena flotation is quite unaffected by cyanide over this range of concentrations. Without cyanide galena and pyrite were not separable using 25 mg/L sodium ethylxanthate (or even with significantly higher xanthate concentrations). With the addition of as little as 10 mg/L NaCN, galena may be readily floated away from pyrite at approximately 7.5 < pH < 10.4.
Zinc sulfate, i.e. ZnSO4·7H2O, is a depressant. It is good for sphalerite depression. In basic solution Zn(OH)2 may form, which can coat onto ZnS and render the particles hydrophilic. Likewise zinc can precipitate with cyanide:
\[
\ce{Zn^{2+}_{aq} + 2CN^-_{aq} -> Zn(CN)_2{}_{s}}
\tag{18}\]
and the Zn(CN)2 can coat on the sphalerite particles, rendering the surface hydrophilic. (Getting the stoichiometry right is important; excess cyanide solubilizes Zn(CN)2 to form [Zn(CN)3]- and [Zn(CN)4]2-). Zinc might also partially offset activation by Cu+2 by shifting the equilibrium,
\[
\ce{Cu^{2+}_{aq} + ZnS_{s} <=> CuS_{s} + Zn^{2+}_{aq}}
\tag{19}\]
to the left. Zinc sulfate is only effective at alkaline pH.
Sulfur dioxide, SO2, depresses PbS in copper-lead sulfides separation. It also suppresses ZnS flotation by xanthates. Chalcopyrite is activated by SO2. It does not depress flotation of many copper sulfide minerals, but some copper minerals (chalcocite and covellite) are dissolved by the acidic SO2 solutions. Sulfur dioxide does not dissolve precious metals (whereas cyanide does), but it may interfere with some collectors.
K2Cr2O7 is used to depress galena in copper-lead sulfide mineral systems. Lead chromate, PbCrO4 (Ksp = 1.3x10⁻⁴), forms and is hydrophilic.
Polar organic materials such as tannin, starch, quebracho and dextrin form colloidal particles that can coat onto mineral surfaces. These may be used to depress gangue minerals such as talc, graphite and calcite. They are not as effective as ionized inorganic depressants.
3. pH modifiers
These were mentioned earlier in the context of the effect of pH on flotation. pH control utilizes larger amounts of chemicals than collectors. The latter are expensive, but are used at low concentration. If acid pH adjustment is needed, sulfuric acid is the cheapest choice. Sulfur dioxide may also be used.
Engineering Flotation Circuits for Mixtures of Minerals
There are two common types of basic flotation circuits employed. Consider an example of a mixed copper/zinc sulfide ore. The ore is ground and then subjected to flotation.
1. Differential circuits
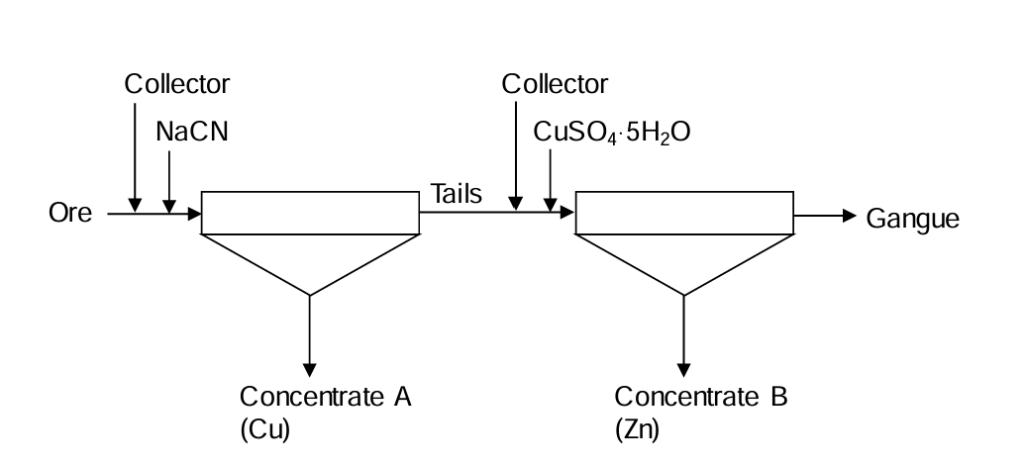
See Figure 6.25 Collector (e.g. a xanthate) is added with the ore, along with a depressant (NaCN in this case) to suppress ZnS flotation (preventing unintentional activation of sphalerite by leached copper mineral). A copper concentrate is produced. The tailings from this operation proceed to the next section. More collector is added along with an activator (CuSO4 here) to float out ZnS. A differentiation is made between the minerals from the ore directly (each desired mineral is floated from the ore). Note that the rectangle with a triangle below it is the symbol for a flotation operation. The flotation concentrate is shown exiting the apex of the triangle.
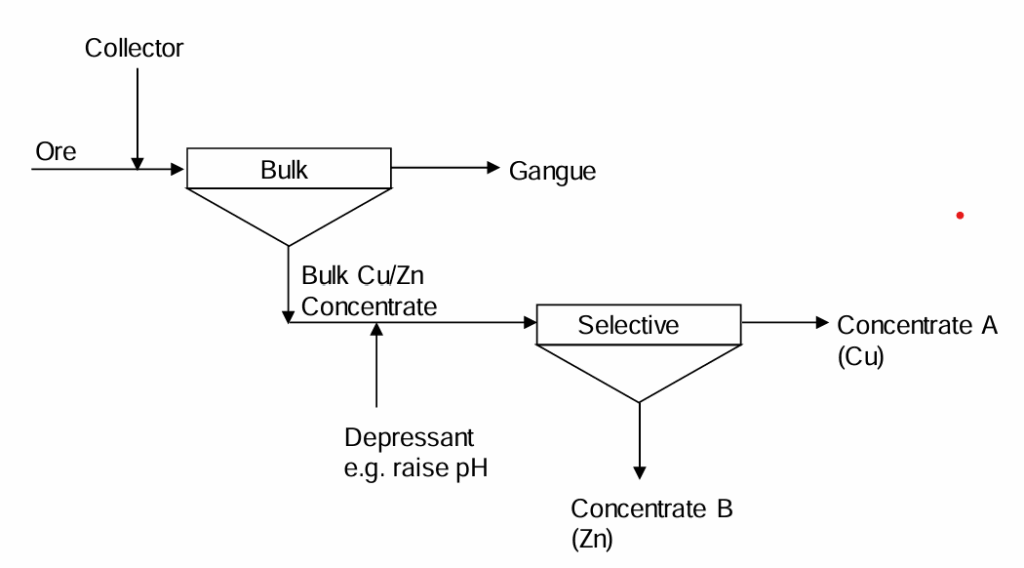
2. Bulk/Selective Circuits
See Figure 6.26 (below) In this case a mixed (bulk) concentrate is recovered in a preliminary stage. Then the concentrate is separated into the two concentrates of interest. (Neither is directly recovered from the ore, but from the bulk concentrate.) All the collector is added at the start. To treat the bulk concentrate a depressant is added (e.g. simply a matter of raising the pH to sufficient levels prevents CuFeS2 flotation) and the zinc sulfide mineral is floated out selectively. The “tailings” (mineral not floated) is the copper sulfide. This is the other product.
Differential circuits can be recognized by two features. Most of the ore passes through both stages. (Ores will typically have low grades of sulfide minerals, so removing one as a concentrate results in little decrease in the mass flow rate.) Second, there are two concentrates produced, one from each stage and both are flotation concentrates. Bulk-selective circuits can be recognized by two features as well. Most of the ore passes through just the first stage. The amount passing through the second stage (the bulk concentrate) is relatively small since the grades of the minerals of interest are low. Second there are two concentrates produced, both from the second stage; one is a flotation product and the other is the "tailings" of that stage.
Differential circuits can afford better separations since both stages are independently controllable. With bulk-selective circuits both products are obtained from a single stage, so there is less control. The tailings concentrate from a bulk-selective circuit tends to have more gangue associated with it. Bulk-selective circuits are less expensive to build and to operate. Less material is handled in the second step, requiring smaller equipment and lesser amounts of reagents. Thus there is a tradeoff, which is commonplace in extractive metallurgy.
In practice flotation takes place in a number of banks of cells operated in series, and with different sets of conditions in order to maximize both recovery and grade. A single set of conditions is not efficient enough to be effective. As noted previously, good recovery and good grade typically cannot be obtained from a single mineral processing step under a single set of conditions. Tailings from one step are fed to the next step in the series. This is illustrated in Figure 6.26 for the recovery of copper sulfide minerals (covellite, chalcopyrite and bornite in this instance) from an ore also containing iron sulfides (pyrite and pyrrhotite). The feed copper grade is 0.75%. This is a low-grade ore. (Although this is high for a copper ore by modern standards.) The feed slurry from the grinding circuit contains 50% solids and 50% water by weight. Base (lime), collector and frother are added in the grinding circuit. It takes time for the reactions go to completion. Alternatively, the ground ore can be added to a tank into which some of the reagents are added to allow residence time for the reactions to occur. This tank is called a conditioner.
There are three banks of cells. The feed proceeds first to the “roughers”. These provide a moderate grade, medium recovery concentrate of roughly 15-20% copper content. The tailings from the roughers proceed to the scavengers. Further additions of collector are made along with an activator (CuSO4). The latter is added to activate partially oxidized copper minerals (oxidation of sulfide minerals by oxygen from air occurs; increased surface area due to grinding exposes fresh surface). The further addition of collector provides aggressive flotation conditions to ensure a high degree of recovery of the copper minerals. Selectivity is not the point here; recovery is. The product from scavenger flotation is a middlings fraction. It might contain perhaps about 3% copper. The concentrate product from the roughers proceeds to the “cleaners”. Base and NaCN are added. Cyanide at low concentration acts to depress the iron minerals. Too much cyanide, however, will also depress the copper minerals. (The generalizations on the use of modifiers are not hard and fast rules. Effects may vary depending on pH, concentration, the chemical make-up of the ore, and interaction with solution species.) In this part of the circuit selectivity or high grade is the key, not recovery. The final concentrate product typically contains 20-30% copper.
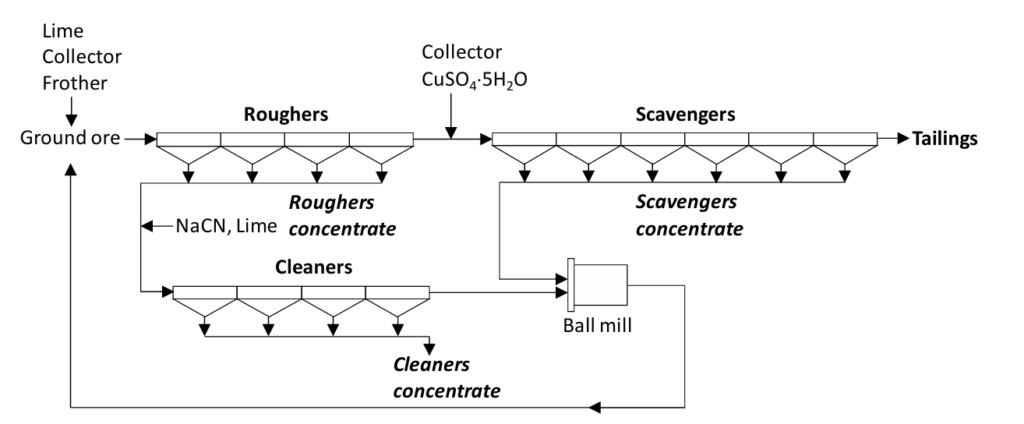
The tailings from the cleaners may contain roughly 10% copper. These too are middlings. The middlings from the cleaner tailings and the scavenger concentrate are reground in a small ball mill. (Only a small fraction of the total ore is passing through this mill.) Regrinding effects further liberation. Then the reground material passes back to the roughers for another attempt at recovering the copper minerals. If there are no other valuable minerals in the ore the tailings from the scavengers are the final waste from the process.
Note that the roughers-scavengers combination looks very much like a differential circuit. Likewise the rougher-cleaners combination is a bulk-selective circuit. There are two products coming from the cleaners flotation stage; one is the final copper concentrate (the flotation product) and the other is the cleaners tailings - the middlings. The incorporation of these two types of circuits in this fairly simple example results in good recovery and good grade of the copper minerals concentrate.
If the copper concentrate product contains 24% copper the extent of upgrading is 24%/0.75% (the ore grade) = 32. The recovery of copper is the ratio of copper mass flow input (in the feed) divided by the mass flow of copper with the concentrate. For 1000 t/h ore feed with 0.75% Cu, if a concentrated is produced at 25 t/h and a grade of 24% Cu, then recovery is:
\[
R = \frac{25t/h \times 24\%}{1000t/h \times 0.75\%}=80.0\%
\tag{20}\]
The rest goes to tailings and is lost. If the copper mineral in the ore is largely chalcopyrite (CuFeS2) a 24% copper concentrate would contain about 70% CuFeS2 by weight.
Molybdenite (MoS2) is often present in such ores at very low grades. However, it is very valuable. It is more readily floated than the copper minerals and so appears in the cleaner concentrate. It may be recovered by flotation of the cleaner concentrate after addition of sufficient NaCN to suppress the copper minerals and a collector. Fuel oil (which is cheaper) can be used with MoS2 since the mineral is naturally fairly hydrophobic anyway. The oil coats on the MoS2 surfaces and permits it to be floated. This is a straightforward example. More complex ores, which are becoming the more commonly available resources, require more complicated flowsheets making good grade and good recovery more difficult.
Flotation Equipment
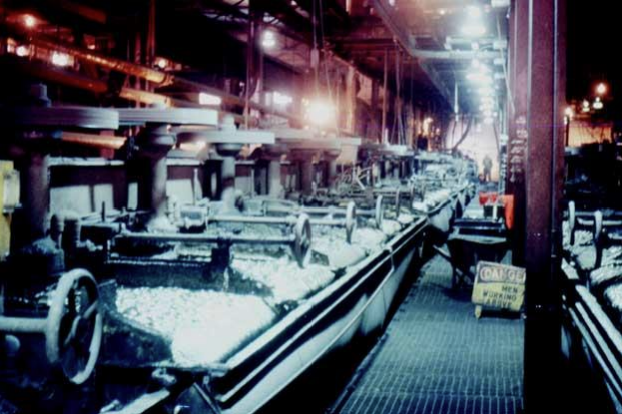
A conventional flotation cell schematic is illustrated in Figure 6.14. Other images of conventional flotation cells are provided below. In Figure 6.28 note that the volume of a cell is small, so many cells are needed to process high throughputs of ore. Figure 6.29. is a photograph of a copper flotation plant in Ontario. Long banks of cells are evident.
Figure 6.28. Photograph of a bank of conventional flotation cells. Cell dimensions are on the scale of about 1 m. Adapted from https://www.alibaba.com/product-detail/Gold-recovery-flotationplant-widely-used_60273898223.html. Retrieved Apr. 9/20.
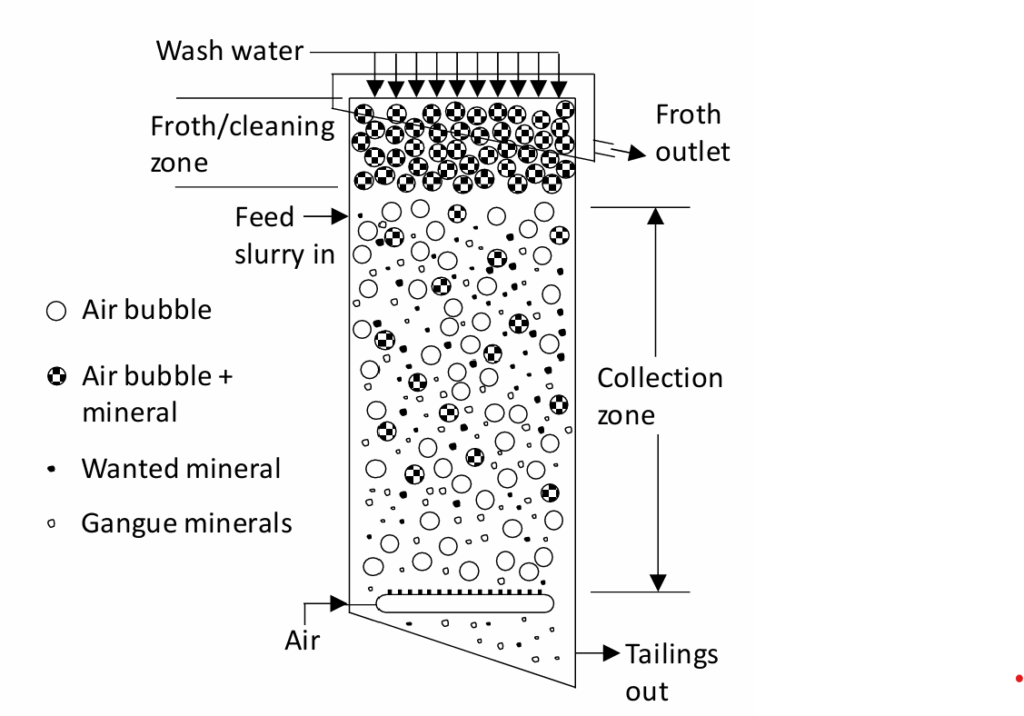
Another important type of flotation process is column flotation. The basic principles are the same. Although this was first developed in about 1919, it was not until the 1960's that industrially successful column flotation cells came into being. In column flotation counter-current flows of feed slurry (solids) and air are employed. The feed slurry enters from near the top and air is sparged from a ring at the base of the column. Air bubbles rise as solid particles fall (see Figure 6.30). Falling particles contact rising air bubbles and those that can attach do and are carried to the top of the column. Water is sprayed onto the top of the column to wash the floated solids, possibly helping to remove gangue particles. Added water also accentuates the flow of solid particles downwards. Motors drive the impellers using belts (not shown)
Falling particles encounter rising air bubbles. Because of counter-current operation and the lengthy collection zone, the probability of a mineral particle contacting a bubble is high. In conventional flotation cells air and ore basically flow in the same direction; co-currently. Mineral particle attachment occurs mainly in the very turbulent region in the vicinity of the impeller. Chances of bubble-particle attachment are lower. Columns have much less turbulence so larger, more massive particles are less likely to be dislodged from air bubbles and very small particles are less likely to be kept from attaching to an air bubble (compared to conventional flotation where the very high turbulence inhibits very fine particles from attaching to air bubbles). Column flotation is more energy efficient, since it does not require the high shear impellers. Column flotation does require higher water usage than conventional flotation.
A relatively new type of flotation cell is the Jameson cell which was introduced in 1988. It does not use an agitator so motors are not needed. Air and slurry are introduced together in a pipe. Slurry is jetted down through air at high speed creating high shear and high entrainment of air bubbles. Air bubbles end up being small (<1 mm) and occupy a substantial fraction of the total volume. Hence rapid and efficient attachment of solid particles to bubbles occurs. The air-entrained slurry is discharged into a tank. Froth carrying the floated minerals rises to the top. Since there are no motors for agitation there is lower energy consumption. The equipment is smaller than for conventional and column flotation per unit throughput due to the intensity of the process. Capital and operating costs may be lower as well. It might have wider applicability as well; very fine particles may be recoverable using Jameson cell flotation that are not recoverable by conventional equipment.
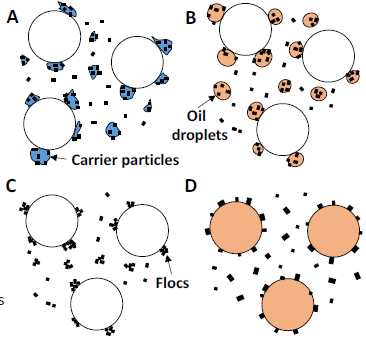
There are other types of flotation techniques in addition to froth flotation. These are illustrated in Figure 6.31 (above). Froth flotation commonly requires particle sizes in the range 10-100 µm. Other techniques employ additional effects. In carrier flotation other intentionally added particles scavenge very fine particles. Air is still used. The addition of oil droplets may allow for attachment of some particles to the droplets. These in turn, being hydrophobic, attach to the air bubbles. Flocculants may be added to agglomerate very fine particles into somewhat larger aggregates, which can be floated. Finally, oil droplets may be used in place of air.
Media Attributions
- Ch2_F27_Physical_Property_Distribution © Peter Hayes is licensed under a All Rights Reserved license
- Ch2_F28_Good_Grade_v_Recovery © Bé Wassink and Amir M. Dehkoda is licensed under a CC BY-NC (Attribution NonCommercial) license
- Ch2_F29_Concentrator_Schematic © Bé Wassink and Amir M. Dehkoda is licensed under a CC BY-NC (Attribution NonCommercial) license
- Ch2_F30_Density_Separation © Peter Hayes is licensed under a All Rights Reserved license
- Ch2_F31_Shaking_Table © Peter Hayes is licensed under a All Rights Reserved license
- Ch2_F32_Centrifugal_Concentrator © Bé Wassink and Amir M. Dehkoda is licensed under a CC BY-NC (Attribution NonCommercial) license
- Ch2_F33_Magnetic_Poles © Bé Wassink and Amir M. Dehkoda is licensed under a CC BY-NC (Attribution NonCommercial) license
- Ch2_F34_Magnetic_Separator © Bé Wassink and Amir M. Dehkoda is licensed under a CC BY-NC (Attribution NonCommercial) license
- Ch2_F35_Drum_Separators © Bé Wassink and Amir M. Dehkoda is licensed under a CC BY-NC (Attribution NonCommercial) license
- Ch2_F36_High_Intensity_Mag_Separator © Bé Wassink and Amir M. Dehkoda is licensed under a CC BY-NC (Attribution NonCommercial) license
- Ch2_F37_Electrostatic_Separator © E.P. Dyrenforth adapted by Jeno Hwang is licensed under a CC BY-NC (Attribution NonCommercial) license
- Ch2_F38_Ion_Bombardment © E.P. Dyrenforth adapted by Jeno Hwang is licensed under a CC BY-NC (Attribution NonCommercial) license
- Ch2_F39_Treating_Beach_Sand © Bé Wassink and Amir M. Dehkoda adapted by Jeno Hwang is licensed under a CC BY-NC (Attribution NonCommercial) license
- Ch2_F40_Conventional_Flotation_Cell © Bé Wassink and Amir M. Dehkoda is licensed under a CC BY-NC (Attribution NonCommercial) license
- Ch2_F41_Contact_Angle © Bé Wassink and Amir M. Dehkoda is licensed under a CC BY-NC (Attribution NonCommercial) license
- Ch2_F42_Weak_v_Strong_Attachment © Bé Wassink and Amir M. Dehkoda is licensed under a CC BY-NC (Attribution NonCommercial) license
- Ch2_F43_Sodium_Ethyl_Xanthate © Bé Wassink and Amir M. Dehkoda is licensed under a CC BY-NC (Attribution NonCommercial) license
- Ch2_F44_Collector_Adsorption © Bé Wassink and Amir M. Dehkoda is licensed under a CC BY-NC (Attribution NonCommercial) license
- Ch2_F45_Collector_Concentration_Effect © Bé Wassink and Amir M. Dehkoda is licensed under a CC BY-NC (Attribution NonCommercial) license
- Ch2_F46_Collectors_Classification © V.A. Glembotskii, V.I. Klassen and I.N. Plaksin adapted by Jeno Hwang is licensed under a All Rights Reserved license
- Ch2_F47_Dithiophosphates_Product © Bé Wassink and Amir M. Dehkoda is licensed under a CC BY-NC (Attribution NonCommercial) license
- Ch2_F48_Adsorption_Equilibria © Bé Wassink and Amir M. Dehkoda is licensed under a CC BY-NC (Attribution NonCommercial) license
- Ch2_F49_Ethylxanthate_pH_Curve © Peter Hayes is licensed under a All Rights Reserved license
- CH2_F50_Cyanide_Ethylxanthate © Peter Hayes is licensed under a All Rights Reserved license
- Ch2_F51_Differential_Flotation_Circuit © Bé Wassink and Amir M. Dehkoda is licensed under a CC BY-NC (Attribution NonCommercial) license
- Ch2_F52_Bulk_selective_Flotation © Bé Wassink and Amir M. Dehkoda is licensed under a CC BY-NC (Attribution NonCommercial) license
- Ch2_F53_Copper_Sulfide_Flotation © Bé Wassink and Amir M. Dehkoda is licensed under a CC BY-NC (Attribution NonCommercial) license
- Ch2_F54_Falconbridge_Flotation © Plazak is licensed under a CC BY-SA (Attribution ShareAlike) license
- Ch2_F55_Column_Flotation © Bé Wassink and Amir M. Dehkoda is licensed under a CC BY-NC (Attribution NonCommercial) license
- Ch2_F56_Mineral_Flotation_Variation © Peter Hayes is licensed under a All Rights Reserved license
