Chapter VII: Electrowinning
6. Electrowinning other Metals
Figure 6.1 shows potential/molal ion activity relationships. These E values are essentially plots of ΔE for the half reactions relative to the standard hydrogen electrode (as per the Nernst equation) versus ion activity (on the molal scale). The values at the right hand axis are E° values for the various metal ion reductions (where a = 1 m):
\[\mathrm{M}^{n+} + n\,e^- \;\longrightarrow\; \mathrm{M}\tag{134}\]
The slopes are derived from the Nernst equation at 25°C:
\[E=E^\circ-\frac{0.05916}{n}\log\!\left(\frac{1}{a_{\mathrm{M}^{n+}}}\right)\tag{135}\]
Note again that orders of magnitude change are needed in ionic activities to effect large changes in E. In electrowinning it is desirable to have high electrolyte concentrations to maintain high energy efficiency (lower applied voltages). From equation {135} as the metal ion concentration drops, EMn+/M also decreases, and ΔE
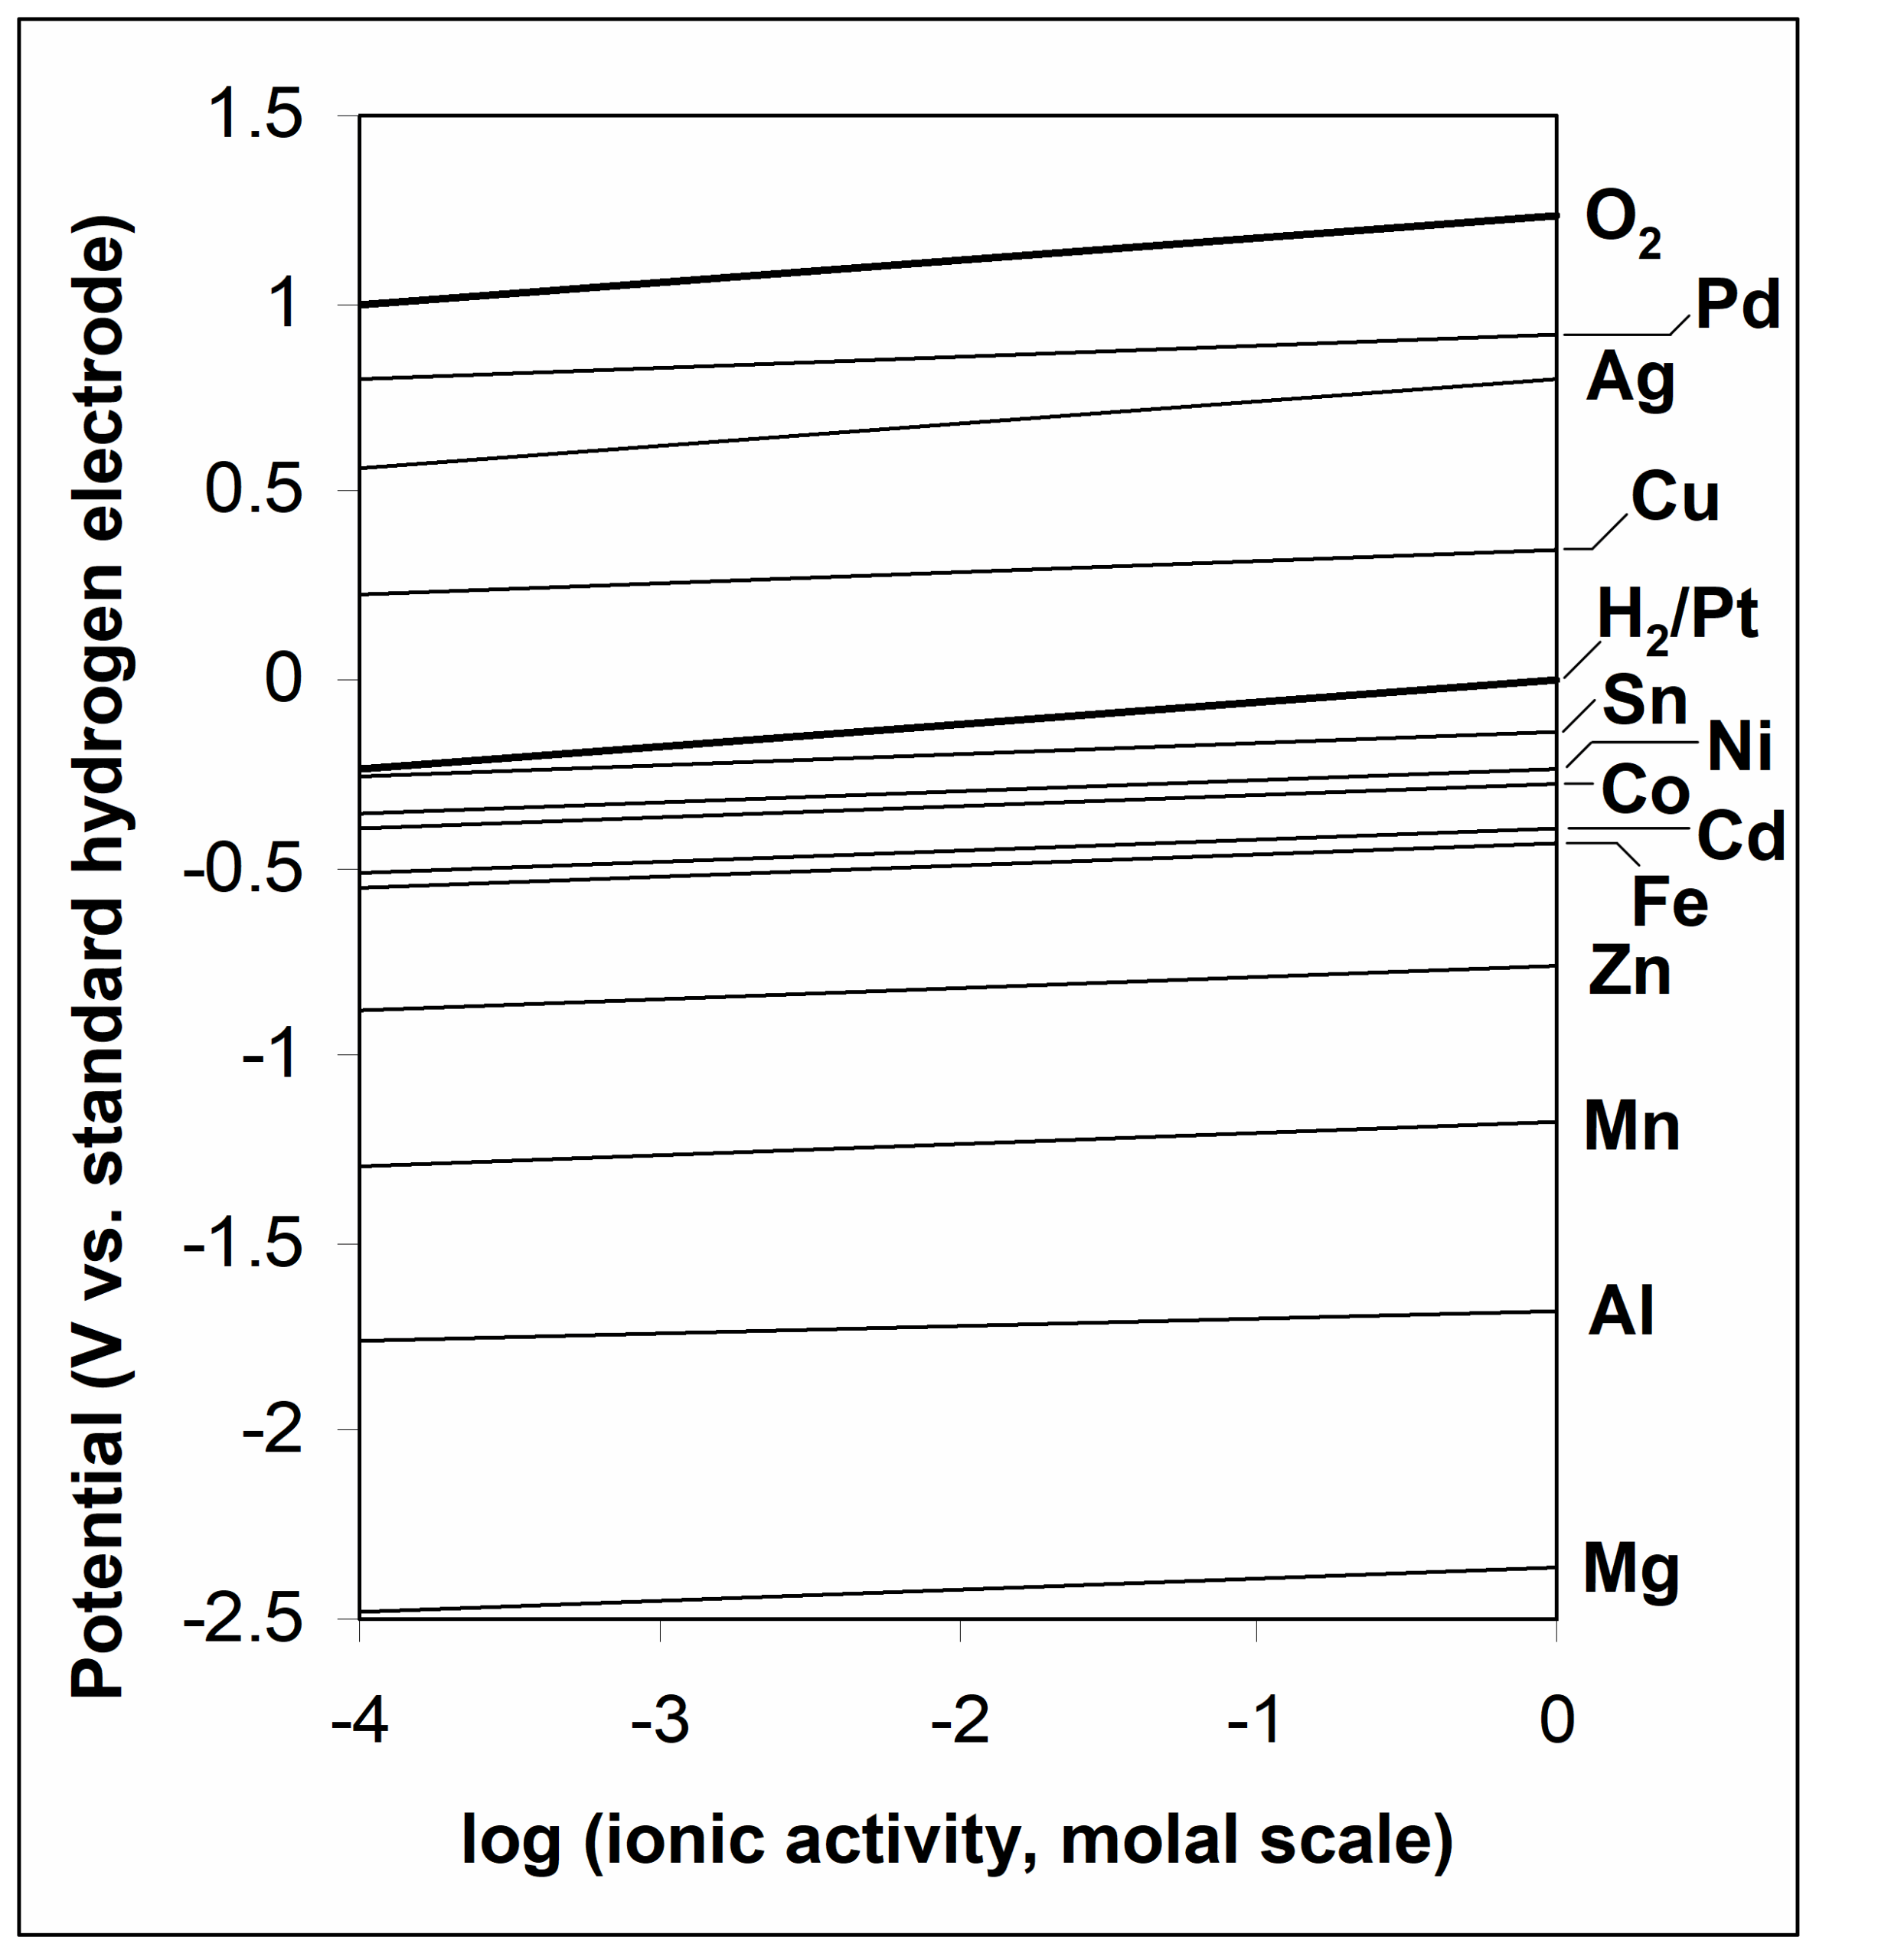
becomes a bigger negative number (ΔEappl has to increase):
\[\Delta E=E_{\mathrm{M^{n+}/M}}-E_{\mathrm{O_2/H_2O}}\qquad\text{with } E_{\mathrm{O_2/H_2O}} \approx 1.23~\text{V}\tag{136}\]
In addition, lower concentrations will necessarily result in lower limiting current densities, making the operation inefficient. Most metal sulfates are soluble to a maximum of around 1 M, so electrolysis on concentrated solutions tends to be feasible.
Note the positions of the H+/H2 and O2/H2O lines. Generally, metal ions with E° > E°O2/H2O cannot electrowon from aqueous solution. They are too strongly oxidizing and the simple cations do not persist in water; water would be oxidized by them. So, for instance, Au+ (E°Au+/Au = 1.69 V) cannot be formed in water at any practical concentration. (Some complexes of gold have lower E° values and can persist in aqueous solutions.) Most metal ions have E°Mn+/M < 0 V, so that hydrogen evolution is the favoured process, thermodynamically speaking. Aluminum and magnesium cannot be electrowon from aqueous solution. The potentials are so negative that only H2 evolution could occur.* Relatively few metals have E°Mn+/M > 0 V. The higher this E° value, the more noble the metal is said to be. For these metals hydrogen evolution is not a concern.
But, why then can aluminum be put in contact with water without noticeable effect? Because of a very strong, adherent oxide coating that forms on the Al surface and protects it from corrosion. This is another case of kinetic stabilization, making the thermodynamically favourable process very slow. In a sufficiently acidic or basic solution, that oxide coating gets broken down, and aluminum corrodes. The same considerations apply to titanium (E°Ti+2/Ti = -1.6 V), which also forms a stable TiO2 layer on its surface. This layer is stable in an acidic and oxidizing environment, but degrades under reducing conditions.
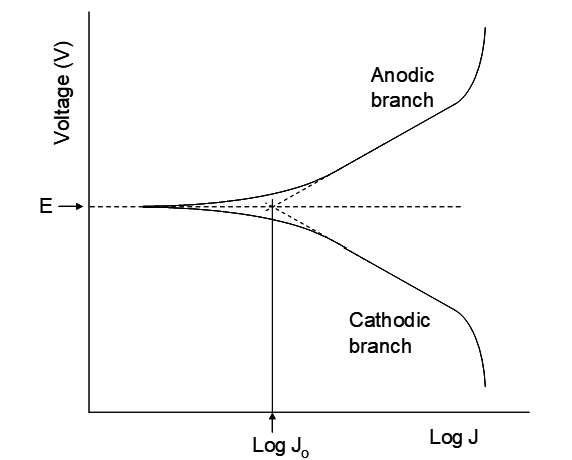
For metals with E°Mn+/M < 0 V the rate of hydrogen evolution relative to metal plating rate is a crucially important question. Referring back to Figure 4.1 this is the point where the linear regions of the polarization curves intersect, usually at a potential close to E, the thermodynamic potential for the couple (0 V when aH+ = 1, PH2 = 1 atm, or as per the Nernst equation under other conditions). This is illustrated in Figure 6.2. If one were to set up a cell with the H+/H2 half reaction occurring on Pt electrodes, and with both half cells under identical conditions, there would be no net effect. No voltage would exist between the two electrodes and there would be no change in composition in either half cell. However, H2 would be undergoing oxidation and H+ would be undergoing reduction to H2, but, both at identical rates. The rate at which electrons are being exchanged between H+ and H2 is the exchange current density. It is this current that is estimated by the
intersection of the Tafel regions in Figure 6.2. The system just described is at equilibrium, but equilibrium is a dynamic situation; reaction is still occurring, but the forward and backward rates are identical. In essence, a higher Jo means that the overvoltage for the hydrogen evolution half reaction is smaller.
There are correlations that provide something of an explanation for the variation in exchange current densities. For instance, the exchange current densities can be at least partially correlated with the strength of the metal-hydrogen bond. To make sense of this, consider the nature of the H+ reduction process on a metal surface. H+ may adsorb onto the surface, then accept an electron. This forms an adsorbed H atom. Two of these H atoms must then combine to form H2 gas. If the metal-hydrogen bond is very weak, this inhibits the electron transfer; a high-energy intermediate state (adsorbed H) involves a highly endothermic reaction that is not very favourable. If the metal-hydrogen bond is fairly strong, then the electron transfer is favourable. But if the metal-hydrogen bond is very strong, then the formation of H2 is inhibited, and again this would slow the overall reaction.
Note the enormous range of current densities for the H+/H2 exchange current density. They range from about 10 A/m2 to 5 x 10⁻⁹ A/m2. This spans almost 12 orders of magnitude! Platinum has the highest exchange current density. It is a very good catalyst for promoting hydrogen evolution. (This is why fuel cells have used platinum electrodes; unfortunately it makes the technology very expensive. Much research has gone into searching for alternative electrode materials that are cheaper. Rhenium has a very similar Jo to Pt, but it is even more expensive.)
Consider the example of the Zn+2/Zn couple. E°Zn+2/Zn is -0.76 V, which is well below H+/H2. This is illustrated from the Eh-pH diagram in Figure 6.3. At all pH where Zn+2 can predominate H2 evolution is the thermodynamically favoured process. Beyond pH ~6.2 Zn+2 is no longer dominant, but rather solid ZnO is. But, the rate of hydrogen evolution on pure Zn is very slow (Jo = 3.2 x 10⁻⁷ A/m2) which indicates a high overvoltage for H2 evolution. Thus it is practically feasible to electrowin zinc metal from ZnSO4 solution. The rate of Zn plating is much greater and outruns the much more thermodynamically favourable, but much slower H+ reduction. Indeed, Zn EW is practiced from quite acidic solutions containing on the order of 100 g/L H2SO4. (This helps with conductivity of the electrolyte and also is important for the leaching process, which uses acid generated in EW.) This same phenomenon allows Mn EW as well, albeit with at best about 60% current efficiency, the rest going to make H2. And in this case high acidity cannot be tolerated. The solution must have a relatively high pH, though not so high as to precipitate an Mn(II) hydrolysis product, Mn(OH)2.
Purity of the electrolyte is a critical issue in Zn EW. Small amounts of Co+2, Ni+2, etc. will readily deposit the parent metals on the zinc surface; E°Ni+2/Ni and E°Co+2/Co > E°Zn+2/Zn. Then regions of say Co metal form on the zinc surface. The rate of H2 evolution on Co and Ni is quite high, so now hydrogen evolution has a site on the Zn cathode surface where it can readily occur, thus opening up a kinetically facile pathway for the thermodynamically favoured process. Then current efficiency for zinc EW plummets and hydrogen gas is produced. Hence one of the biggest concerns in zinc hydrometallurgy is electrolyte purification.
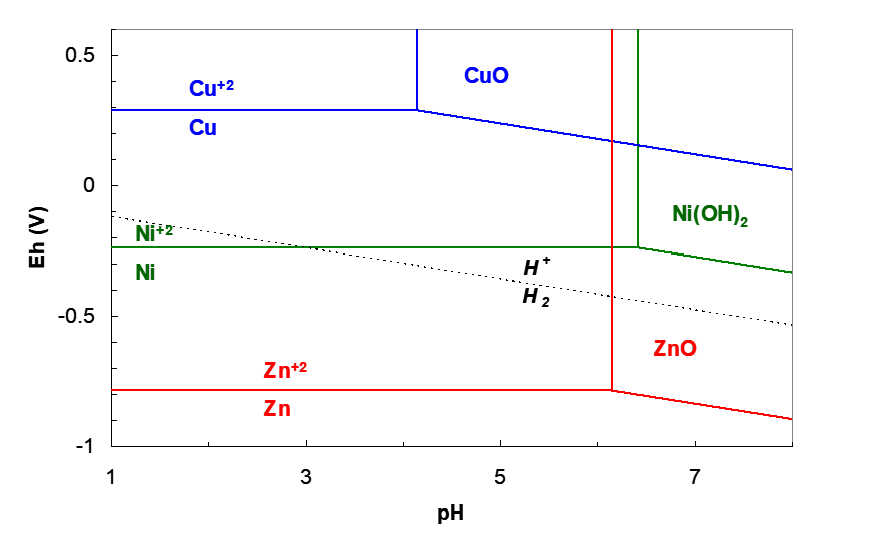
Metals in the Group VIII block of the periodic table exhibit especially high rates of hydrogen evolution. The Ni, Pd and Pt column have the highest rates of any group. For instance, E°Ni+2/Ni = -0.24 V and the rate of hydrogen evolution on Ni is relatively high as well. So how can we electrowin Ni metal and those like it? Consider again the Eh-pH diagram in Figure 6.3. The H+/H2 and Ni+2/Ni lines intersect at pH 3. Below this pH H+ is easier to reduce to H2 than reduction of Ni+2 to Ni. Above this pH Ni+2 is the stronger oxidant; EhNi+2/Ni > EhH+/H2. This means that Ni+2 can be electrowon above this pH. However, above pH 6.4, Ni(OH)2 precipitates and this would foul the cathodes, introduce hydrogen and oxygen impurities into the solid and passivate the electrode surface. Hence the pH must be kept at 3 < pH < 6.4 (at these ionic activities, at least). In practice, the cathodes and anodes are physically separated using porous cloth bags that surround either the cathodes or the anodes. This is illustrated in Figure 6.4. Here bags surround the cathodes. Nickel sulfate solution is pumped into the cathode bags (called the catholyte). This maintains a small hydrostatic head in the bags, relative to the level in the anode compartment (the anolyte solution). Hence solution flows from the cathode chamber to the anode chamber. This prevents anolyte solution from coming into contact with the cathodes. In the anode chamber acid is produced via oxygen evolution (in sulfate medium):
\[\ce{SO4^2- + H2O -> H2SO4 + 1/2 O2 + 2e-}\tag{137}\]
The increasing acid concentration is prevented from coming into contact with the cathodes using the cloth bags. The anolyte is pumped out at the same rate that the catholyte is pumped in. The anolyte is continuously neutralized with NaOH. Nickel-enriched, neutralized catholyte is pumped back into the cathode bags. All this adds considerable expense. The conductivity of the electrolyte is also lowered by having to avoid H+ (which is the best ionic conductor) and use Na2SO4 instead. This adds to the energy costs. However, nickel is valuable enough that this can be tolerated. Another variation on Ni EW is to use chloride medium. This has advantages in leaching, though it is more corrosive. Then Cl2 gas is formed at the anode. Now the anode chambers must be enclosed and the Cl2 gas must be collected; it is highly toxic and it is very useful in leaching. Again, it is imperative that powerfully oxidizing Cl2 not come into contact with the cathodes, or EW will cease. Hence again separate cathode and anode chambers are required.
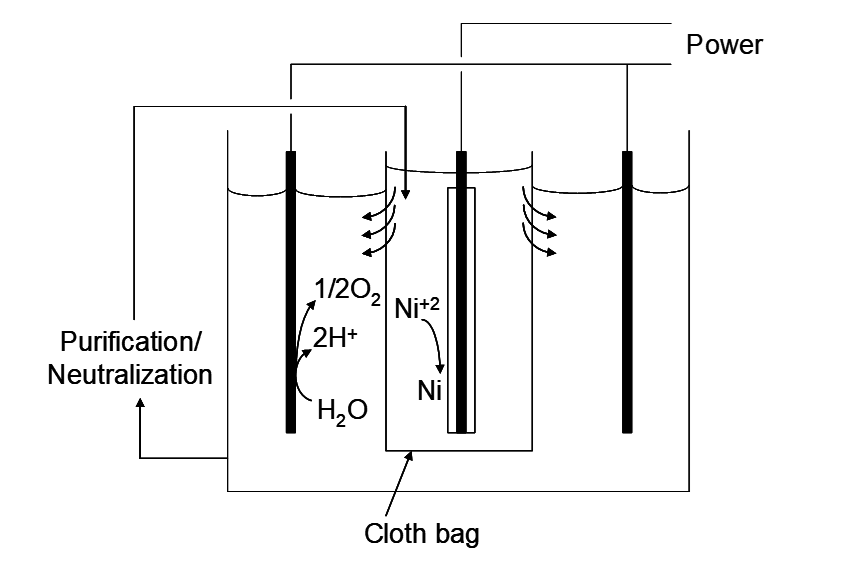
In practice some degree of hydrogen evolution occurs in nickel electrowinning. Although this represents a loss of current efficiency, one side benefit is that it produces a great deal of mixing in the vicinity of the cathode. Small bubbles growing and dislodging generate significant mass transport. The reduction of H+ to H2 at the electrode surface necessarily raises the local pH there. This can lead to precipitation of Ni(OH)2 with attendant passivation. To overcome this B(OH)3 (boric acid) is commonly added. This weak acid reacts with OH- to help buffer the local pH in an acceptable range.
The Eh-pH diagram in Figure 6.3 also illustrates why copper can be so easily electrowon. The Cu+2/Cu reduction potential lies well above the H+/H2 line at all pH where Cu+2 is predominant. Cu+2 is simply a much stronger oxidant and so copper can be electrowon from acid solution.
Media Attributions
- Ch7_F19_Potential-Ionic_Activity_Relation © Bé Wassink and Amir M. Dehkoda is licensed under a CC BY-NC (Attribution NonCommercial) license
- Ch7_F20_Exchange_Current_Density_Tafel_Extrapolation © Bé Wassink and Amir M. Dehkoda is licensed under a CC BY-NC (Attribution NonCommercial) license
- Ch7_F21_Cu_Zn_Ni_Partial_Eh-pH © Bé Wassink and Amir M. Dehkoda is licensed under a CC BY-NC (Attribution NonCommercial) license
- Ch7_F22_Ni_EW_Cell_Configuration © Bé Wassink and Amir M. Dehkoda is licensed under a CC BY-NC (Attribution NonCommercial) license
A unit of concentration. 1 molal = 1 mole of specified solute per kg of solvent. Symbol: m. This is the common unit for concentration in thermodynamics. (Molarity is moles of solute per litre of solution. This is operationally convenient and thermodynamically inconvenient, since volume varies with temperature. Hence so does molarity. Molality does not vary with temperature.)
Electrolysis practiced specifically for plating metal. Also abbreviated as EW.
