Chapter V: Solid Liquid Separation
4. Filtration
Filtration involves a physical barrier which is porous enough to allow passage of water or solution, but not solids. The solids are retained on one side and the solution/water passes through to the other side. A pressure difference must be applied to obtain reasonable rates. Vacuum filters employ reduced pressure on the clarified solution side. Solution is then sucked through. A filter press uses positive pressure on the side where solids are retained. As water passes through a filter cake builds up which progressively impedes the flow.
Filters can handle very fine solids. As a filter cake begins to build up it acts to prevent movement of very fine particles through the filter membrane. If particles are too fine they can block the pores in the filter cloth, preventing solution from going through. Important factors in filtering are particle size and shape (affects how the particles will pack together in the cake and in the surface of the filter cloth), particle size distribution (small particles in among larger ones can block inter-particle spaces and slow filtration), solution viscosity, pressure drop across the filter, filter cloth porosity, thickness etc. Thorough testing is required for each new application.
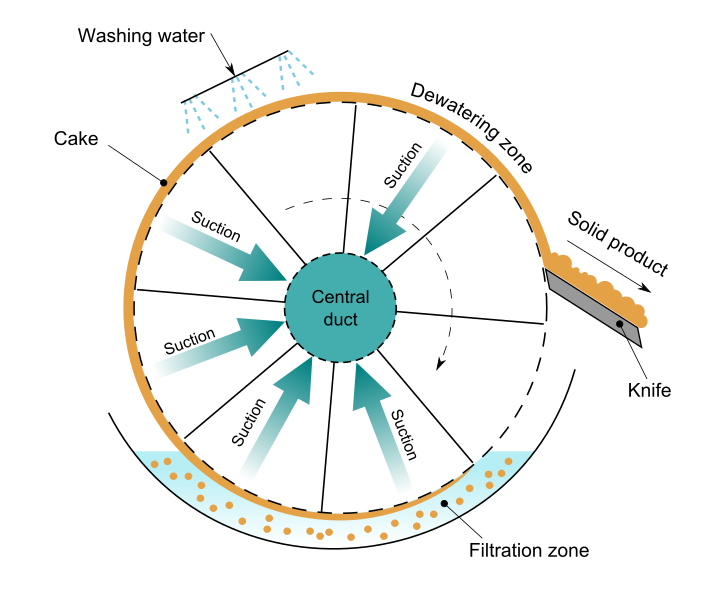
There are many types of filters, but one of the more common is a drum filter. These are long cylindrical devices. An illustration is provided in the diagram below. A filter cloth surrounds the drum. The drum dips into a trough containing the feed slurry and rotates at about 0.1-3 rpm. The drum is divided into several compartments. First slurry is picked up by the drum under reduced pressure. The solution passes through and may be directed for further processing. Next the cake is washed. Wash water passes through the drum and is collected separately. As the drum continues to rotate the wash water is sucked through and the caked is partially dried. In the final section the cloth passes over a roller. A blade scrapes the partially dried cake off. The cloth is then washed with water and returns to the trough to pick up fresh slurry. This is a continuous process. Belt filters work similarly, but they use a long belt onto which slurry is fed. Again the belt passes over various sections. A great deal of research, work and engineering goes into designing and implementing solid-liquid separation processes.
Filters give better solid-liquid separation than thickeners and better washing. Sometimes a filtration may be required after CCD washing; the final overflow from a CCD wash circuit may still have unacceptably high levels of fine solids. It is much easier to filter a solution containing low amounts of solids than to filter a slurry with a high percentage of solids. Hence the rationale for combining CCD washing with a final filtration.
There are two basic types of filters. Vacuum filters utilize reduced pressure on the underside of the filter cake, as in the drum filter example above. These are better suited to filtration of higher pulp density slurries. Pressure filters utilize positive pressure on the feed side of the filter. These are best for slurries with low solids content, like CCD overflow clarification.
Filter Theory
Filter theory follows the analogy of electrical circuits with resistance to flow being expressed in a similar manner as resistance to electric current flow. Let the rate of passage of clear solution through a filter be dV/dt = Qf. Experimentally it has been shown that Qf may be expressed as follows (Darcy’s law),
\[
\ce{Q_f = \frac{A \Delta}{\alpha \mu L}} \tag{37}
\]
where A = surface area,
- ΔP = pressure drop
- μ = filtrate viscosity (e.g. Kg/m sec units)
- L = filter cake thickness
- 1/α = specific cake resistance
This is logical. The higher the filter area and pressure, the faster the filtration will be. Similarly, the larger the viscosity of the solution, the harder it is for it to flow between the particles and through the filter cloth pores. And the deeper the filter cake (which grows with increased filtration time), the greater the resistance to flow. the term 1/α is called the specific cake resistance and is a proportionality constant.
This may be rearranged,
\ce{\frac{\Delta P}{(1/A)\, dV/dt} = \alpha \mu L} \tag{38}
\]
In general resistance = driving force / flux, e.g. as in electricity,
\[
\ce{V = IR = I\rho l/A = (I/A)\rho l = j\rho l} \tag{39}
\]
\[
\ce{V/j = \rho l} \tag{40}
\]
where V = voltage, I = current, R = resistance, = resistivity (ohm cm), l = length, A = area and finally, j = current density (A/cm2 = C/sec/cm2, the charge flux).
The quantity,
\[
\ce{\frac{\Delta P}{(1/A)\, dV/dt}}
\tag{41}
\]
is analogous to V/j in the equation above. The denominator has units of flow per unit time per unit area. Hence ρL is analogous to ρl, i.e. a measure of resistance. This term refers to resistance of the filter cake alone. Another term is needed for the resistance of the filter cloth.
Both the filter cake and the filter cloth resist solution flow. The resistances are additive,
\[
\ce{\frac{\Delta P}{(1/A)\, dV/dt} = \Sigma(\text{resistances}) = R_{cake} + R_{medium}}
\tag{42}
\]
From the preceding discussion,
\[
\ce{R_{cake} = \alpha \mu L}
\tag{43}
\]
The resistance of the filter cloth can be written as,
\[
\ce{R_{medium} = \mu R}
\tag{44}
\]
where R is characteristic of the filter cloth. The incorporation of μ is reasonable since resistance to flow involves the same solution for both cake and filter cloth. In addition, it is helpful to separate out solution viscosity since this can vary form one solution to the next. Now we may write,
\[
\ce{\frac{\Delta P}{(1/A)\, dV/dt} = \alpha \mu L + \mu R}
\tag{45}
\]
Note that the cake thickness increases in direct proportion (linearly) with the amount of filtrate collected. (This assumes that the cake does not compact, which is not necessarily true.) Hence the rate of cake thickness increase is proportional to the concentration of solids in the slurry.
\[
\ce{L = k C V / A}
\tag{46}
\]
where C = solids concentration in the slurry (e.g. in g/L)
V = volume of filtrate passed
k = constant of proportionality
Again this is reasonable. The higher the solids concentration, the greater the cake thickness for a given volume of solution. Likewise, the greater the filtrate volume collected, the greater the amount of cake deposited on the filter. And cake thickness will be thinner the larger the area. The constant k incorporates the bulk density of the solids. Mass/density = volume and volume over area = height (L). If the weight % solids in the slurry is used in lieu of
mass/volume concentration units, then,
\[
\ce{L = k' S V / A}
\tag{47}
\]
where S = weight% solids (sometimes called the pulp density) and k is a different proportionality constant. Substituting (46) into (47),
\[
\ce{\frac{\Delta P}{(1/A)\, dV/dt}
= \alpha \mu k C V / A + \mu R
= \mu \left( k \alpha C V + R \right)/A}
\tag{48}
\]
Combine k α′ into,
\[
\ce{\frac{\Delta P}{(1/A)\, dV/dt} = \mu(\alpha' C V + R)/A}
\tag{49}
\]
Rearranging,
\[
\ce{dV/dt = \frac{\Delta P}{A \mu(\alpha' C V + R)}
= \frac{\Delta P}{A^2 \mu(\alpha' C V + A R)}}
\tag{50}
\]
\[
\ce{dV/dt = \frac{A^2 \Delta P}{\mu(\alpha' C V + A R)}}
\tag{51}
\]
Integrating gives,
\[
\ce{\int_{0}^{V} (\alpha' C V + A R)\, dV = \frac{A^{2} \Delta P}{\mu} \int_{0}^{t} dt}
\tag{52}
\]
\[
\ce{\alpha' C \frac{V^{2}}{2} + A R V = \frac{A^{2} \Delta P\, t}{\mu}}
\tag{53}
\]
\[
\ce{\alpha' C \frac{V^{2}}{2} + A R V = \frac{A^{2} \Delta P\, t}{\mu}}
\tag{54}
\]
\[
\ce{\frac{t}{V} = \frac{\mu}{A^{2} \Delta P}\left(\frac{\alpha' C V}{2} + A R\right)}
\tag{55}
\]
\[
\ce{\frac{t}{V} = \left(\frac{\mu \alpha' C}{2 A^{2} \Delta P}\right) V + \frac{\mu R}{A \Delta P}}
\tag{56}
\]
Hence a plot of t/V versus V should yield a straight line with slope,
\[
\ce{\frac{\mu \alpha' C}{2 A^{2} \Delta P}}
\tag{57}
\]
and y-intercept,
\[
\ce{\frac{\mu R}{A \Delta P}}
\tag{58}
\]
If a filter test is done for a specific slurry and filter, and the volume of filtrate is measured with time then the t/V versus V plot can be drawn. The terms parameters μ, C, A and ΔP are either known or measured. Then α′ and R may be found. Care must be taken to ensure that the units are all consistent. With the following units:
- A (m2)
- ΔP (Kg/m sec2)
- C (Kg/m3) (Kg solids per m3 of slurry)
- μ (Kg/m•sec)
- V (m3)
- t (sec)
The units of α′ are m/Kg and the units of R are m-1. From the values of α′ and R the size of a filter can be estimated for a given application. This assumes that α′ is a constant, i.e. that the cake is incompressible. This is not necessarily so in real life. But, a good first estimate for the required filter size (area) can be obtained. The filtrate volume required in a given time is the required design parameter. From equation (54),
\[
\ce{\frac{\Delta P A^2 t}{\mu} - A R V - \frac{\alpha' C V^2}{2} = 0} \tag{59}
\]
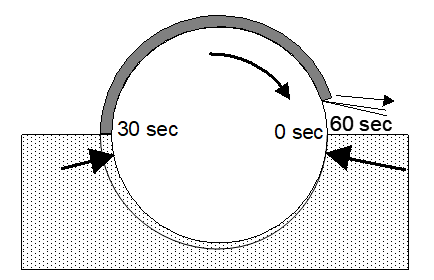
Then the required area can be found. With a drum filter one must bear in mind that the filter is partially submerged in slurry and that the filter cake is removed continuously. This is illustrated in the diagram below, and these factors must also be taken into account.
After filtration a filter cake is washed. In the example above this would happen after the cake exits the slurry. Solution remains in the inter-particle spaces and the solute either needs to be recovered or removed. The inter-particle space is the void volume.
Defining the following terms,
- W = (Volume of wash water) / (void volume in the cake)
- C = Concentration of solute in the wash
- Co = Solute concentration in the filtrate
- Cw = Solute concentration in the wash feed solution (0 for pure water)
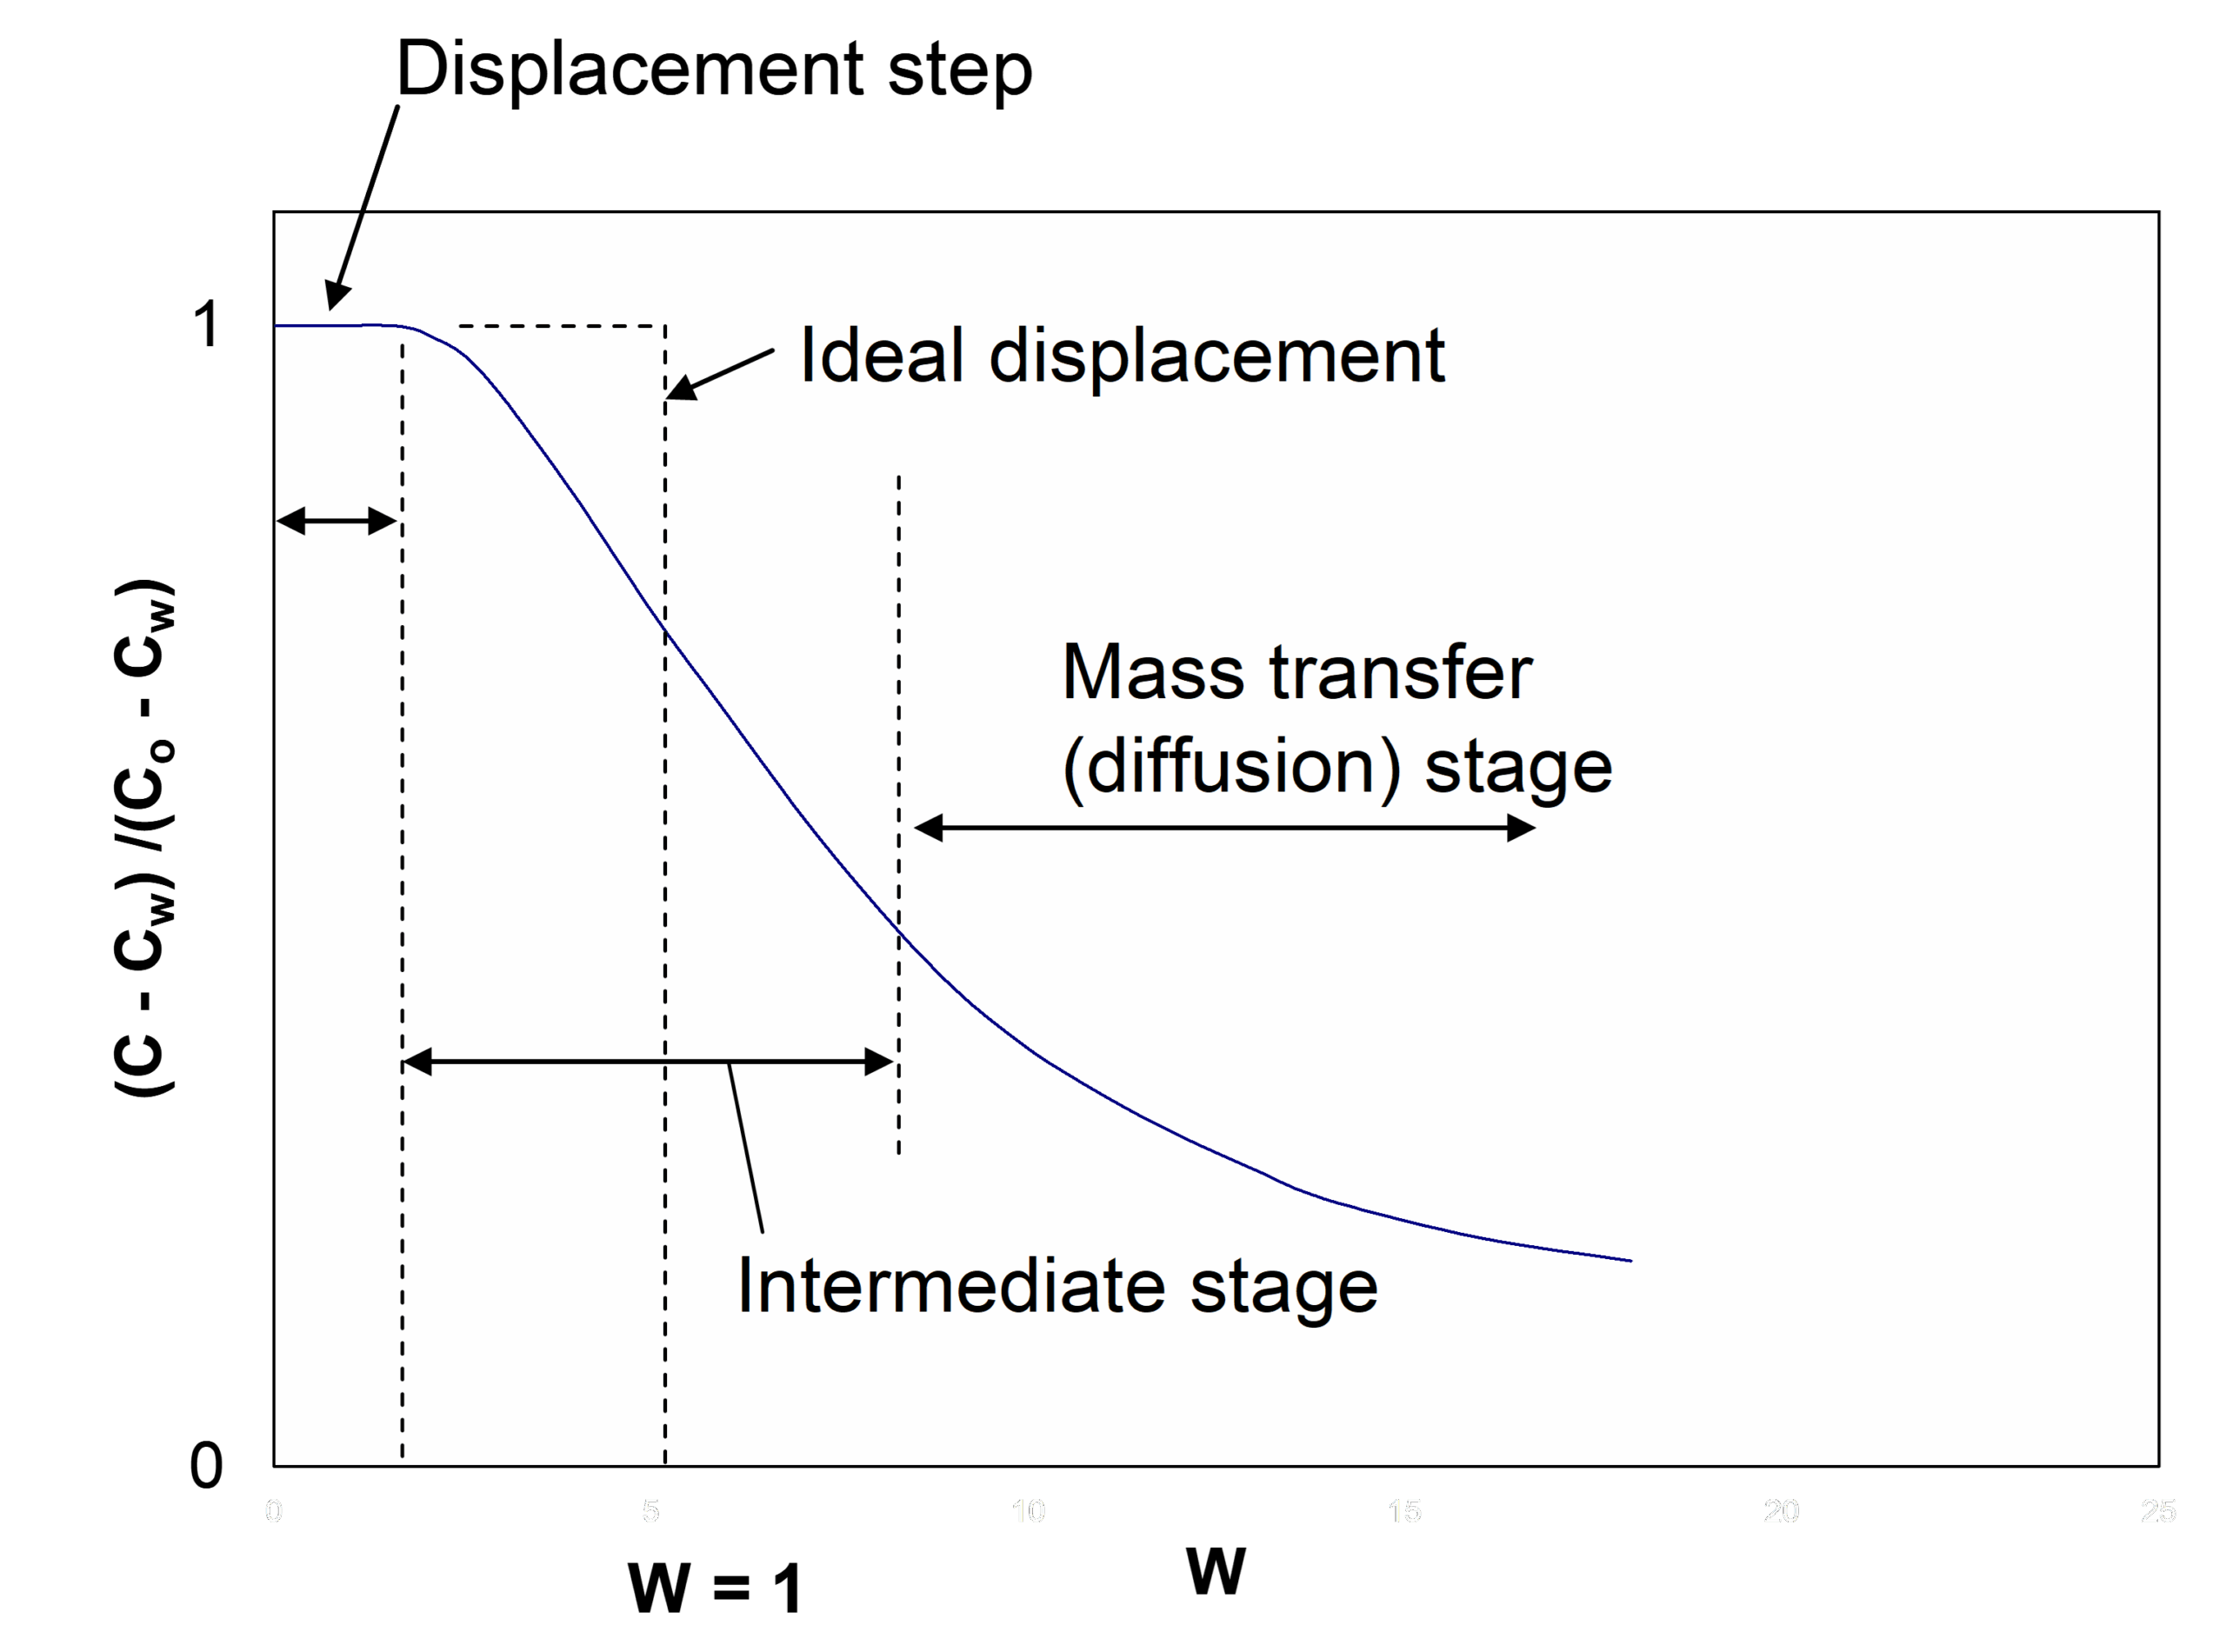
W is the wash ratio. A typical washing curve is illustrated below.
When Cw = 0 (no solute in the added wash water),
\[
\ce{\frac{C - C_w}{C_0 - C_w} = \frac{C}{C_0}}\tag{60}
\]
The mimimum value for the ratio in equation (59) is when C = Cw. The maximum is when C = Co. The limits then are 0 and 1. The expression is essentially the ratio of solute concentration in the wash to that in the filtrate. For perfect plug flow all solute would be displaced by W = 1. This does not occur. Solute is located within the interparticle spaces (and even here perfect plug flow does not pertain), as well as within the particles in pores. The solute in the latter diffuses out only rather slowly.
An empirical equation (the Montcrieff equation) has been developed to simulate solute recovery,
\[
\ce{1 - f = (1 - d)e^{-(W - d)/(1 - d)}} \tag{61}
\]
where f = fractional recovery of the solute (1 at most)
d = fraction of wash water that simply displaces solute
If Wd is the wash ratio where displacement is just complete, then,
\[
\ce{d = W_d / W} \tag{62}
\]
(Within 0 to Wd, (C - Cw)/(Co - Cw) = 1. Beyond Wd the ratio is less than 1.) The term d then varies with the amount of wash water added, i.e. with W. For example if Wd = 0.5
and W = 1, then d = 0.5/1 = 0.5,
\[
\ce{1 - f = (1 - 0.5)e^{-(1 - 0.5)/(1 - 0.5)}} \tag{63}
\]
f = 0.816
If W = 2, d = 0.5/2 = 0.25 and f = 0.927. For a drum and belt filters W > 1 is used, but W >4 would require too much time. The void volume within the filter cake is very small compared to the filtrate volume. Hence even with W = 4 the dilution of the filtrate is very small. With CCD wash circuits the extent of dilution is substantially greater.
Media Attributions
- Ch5_F5_Filter_Drum © Daniele Pugliesi is licensed under a CC BY-SA (Attribution ShareAlike) license
- Ch5_F6_Drum_Filter © Bé Wassink and Amir M. Dehkoda is licensed under a CC BY-NC (Attribution NonCommercial) license
- Ch5_F7_Wash_Curve_Drum_Filter © Bé Wassink and Amir M. Dehkoda is licensed under a CC BY-NC (Attribution NonCommercial) license
