Chapter II: Mineral Processing
3. The Importance of Size Selection in Size Reduction
A size reduction circuit will typically involve more than one machine. The final material exiting a comminution circuit will have a specification for size, commonly to be less than some specified maximum. In many instances (not necessarily all), if the product is too big or too small it will not be adequately suited to the next step in the process, whether that is making a concentrate or extracting metals. But, size reduction machines typically produce quite a broad size distribution.
While crushing machines produce a product with a set maximum size based on the machine discharge opening dimensions, grinding machines produce a distribution of sizes that depends on the length of time spent in the mill. If the ore charge is left in the mill long enough to ensure that the maximum size is less than some specified size, then much of the material will end up being too fine. This is called overgrinding. But, if the charge is left in the mill for a short enough time to avoid forming too much fine material, then the largest particles will still be too big.
The solution is to leave the ore in the mill long enough so that a fraction of the ore is small enough, but not too small, then apply a size selection process to the discharged material. Material that is below a specified size passes on to the next step in the process. Material that is too large gets recycled to the mill for further grinding. We have already seen an application of size selection as applied to primary crushing. Oversize rocks that would clog a crusher can be screened out of the feed by use a "grizzly" screen. Screening is one method of selection or discrimination on the basis of size. Another very important method is the cyclone (or hydroclone where water is the fluid carrying particles rather than air). These select on the basis of differential movement of particles in fluids. There are numerous other size selection machines, but these two are the most common in mineral processing.
When a mill product is size classified and oversize material is recycled back into the mill, this is called closed circuit size reduction. When there is no recycle of oversize back into a mill, this is called open circuit size reduction. Primary crushers are operated in open circuit fashion. Subsequent mills may be closed or open circuit. Some important features of each method are indicated below:
Open circuit:
- Simplicity.
- Used if size classification is not practical.
- Used if product size range is not important.
- May be suitable for a rod mill which produces a somewhat narrower size distribution.
Closed circuit:
- Greater control over the finished product size distribution.
- Increased mill capacity (time and energy are not wasted grinding the entire charge to less than a specified maximum size).
- Power requirements per tonne of finished ore are lowered (for the same reason as the preceding point).
- Less overgrinding and less production of extremely fine particles (smaller particles are removed).
- Costlier and more complex.
Screening
Screens or sieves are surfaces with constant sized openings supported by a frame. Openings may be square, circular, rectangular, etc. Screens may be made of woven wires or perforated sheets. All particles that are smaller than the openings may, in principle, pass through. Particles larger than the openings may not pass through. Undersize may only contain particles less than the opening size. However, oversize that does not pass through may still contain undersized particles if not enough opportunity to contact the screen has been provided. Screens are typically vibrated up and down and side-to-side to maximize probability of contact between the ore particles and the mesh. They are also inclined to use gravity to force flow of the ore over the screen. A particle small enough to pass the screen might hit a wire and bounce off. And the smaller the particle size, the greater the probability that it will pass through. Thus the probability of a particle passing the screen is given by:
\[P = \left(\frac{D_A - d_0}{D_A + D_W}\right)^2\tag{2}\]
where DA = aperture width (square aperture)
DW = screen wire thickness
d0 = diameter of a spherical particle
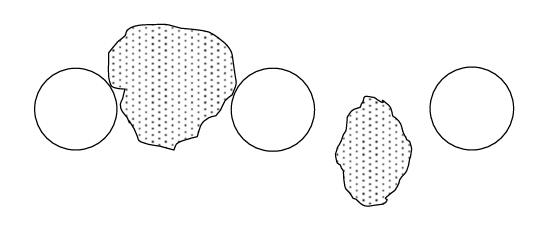
A chart of the probability of passing through for a given number of attempts (number of times a particle contacts the screen) is shown in Table 3.1. The larger do is compared to DA the less likely it is to pass. The greater the number of contacts with the screen, the greater the chances of passing it. An inclined and vibrating screen increases the number of contacts. A problem with screens is "blinding". A particle somewhat too large to pass lodges in an opening and prevents other particles from passing through. This is illustrated in Figure 3.1 (below). Vertical vibration can help to loosen stuck particles. Optimum vertical stroke and horizontal frequency can vary with particle size. Larger particles require longer strokes and lower frequencies. Screens are classified according to their opening sizes and the number of wires per inch (mesh number). A 270 mesh sieve has 270 wires per inch. Obviously as the wires per inch increase the opening size decreases
and the wire diameter decreases.
| Table 3.1 - Probability of a spherical particle passing a screen | |||
|---|---|---|---|
| d0/DA | Probability of passing in % | ||
| 10 attempts | 100 attempts | 1000 attempts | |
| 0.1 | 97.5 | 100 | 100 |
| 0.2 | 94.8 | 100 | 100 |
| 0.4 | 83.9 | 100 | 100 |
| 0.6 | 57.0 | 99.9 | 100 |
| 0.8 | 20.8 | 90.2 | 100 |
| 0.9 | 6.3 | 47.9 | 99.8 |
| 1 | 0 | 0 | 0 |
There are two general classifications, U.S. and Tyler. Table 3.2 indicates the mesh numbers and opening sizes. There are screens with larger openings too.
| Table 3.2 - Mesh numbers and opening sizes for wire sieves*. | |||||
|---|---|---|---|---|---|
| Number/mesh | Opening mm | Number/mesh | Opening mm | ||
| US | Tyler | US | Tyler | ||
| 3.5 | 3.5 | 5.66 | 60 | 60 | 250 |
| 4 | 4 | 4.76 | 70 | 65 | 210 |
| 5 | 5 | 4.00 | 80 | 80 | 177 |
| 6 | 6 | 3.36 | 100 | 100 | 149 |
| 7 | 7 | 2.83 | 120 | 115 | 125 |
| 8 | 8 | 2.38 | 140 | 150 | 105 |
| 10 | 9 | 2.00 | 170 | 170 | 88 |
| 12 | 10 | 1.68 | 200 | 200 | 74 |
| 14 | 12 | 1.41 | 250 | 250 | 63 |
| 16 | 14 | 1.19 | 270 | 270 | 53 |
| 18 | 16 | 1.00 | 325 | 325 | 44 |
| 20 | 18 | 0.841 | 400 | 400 | 37 |
| 25 | 24 | 0.707 | 500 | 30 | |
| 30 | 28 | 0.595 | 600 | 25 | |
| 35 | 32 | 0.500 | 750 | 20 | |
| 40 | 35 | 0.420 | 1000 | 15 | |
| 45 | 42 | 0.354 | 1500 | 10 | |
| 50 | 48 | 0.297 | |||
*Very fine sieves are used in laboratories, but not in industrial screening as they are too fragile.
Screening cannot be used industrially below a minimum size since the screens become too fine and too fragile. Screening in air (dry screening) can be practiced down to about 5 mm. Wet screening is required for smaller particles wherein continuous water flow facilitates particle movement. For particles smaller than about 200-250 μm other types of size classifiers are commonly used. As particles size gets smaller the screen material itself occupies a greater fraction of the surface and throughput can become slow. Vibrating screens are a type of dynamic screen. There are other types of dynamic screens as well, e.g. drums. Screens may be static (unmoving) in some applications.
An interesting type of screen is the probability screen. Their apertures are substantially larger than desired particle size in the product. This type of screen relies on the fact that as particle size increases the probability of passing through decreases. If the frequency of encounters between the particles and the screen is kept low only the much smaller particles will pass through. For 10 attempts the probability of passing approaches 1 when do ≈ 0.1DA. Screening is complex. Estimation of the size of a screen needed should be determined by testing with actual ore to be processed.
Classifiers
Technically classification refers to size selection on the basis of settling of solid particles under gravity in a fluid; air or water. Centrifugal forces may also be involved if particles are moving radially. All the forces involved are gravity, buoyancy, drag and centrifugal forces (where applicable). Depending on conditions such as viscosity, particle size and shape and particle velocity, laminar flow or turbulent flow of the fluid around the particle may occur. Terminal velocity is a key parameter for the settling rate. For laminar flow the terminal velocity is proportional to the square of the particle diameter. For turbulent flow it is related to the square root of diameter. There is less discrimination on the basis of size under turbulent flow conditions. Hence the possibility of separation of particles on the basis of settling rates depends critically on the flow regimes around the particles. Variations in density affect setting rates as well. This is minor for minerals with similar densities, but may be significant for minerals with much different densities (e.g. quartz: 2.65 g/cm3 and galena, PbS: 7.5 g/cm3). It turns out that over the range 0.1 mm - 10 mm laminar flow, turbulent flow and combined regimes exist. This reduces selectivity. For <100 μm particle sizes, the settling velocities become very low. This becomes impractical for industrial processes.* As particle size increases turbulent flow eventually dominates. Here since terminal velocity ∝ diameter1/2, the settling rate is relatively less sensitive to particle size. Larger particles are generally best handled by screening.
*Fine particle size slurries can be effectively settled by adding flocculating agents that bind small particles into larger aggregates called flocs. Being tightly bound together, the more massive aggregate acts like a large particle and settles much more rapidly. This is suitable for solid-liquid separations, but it obviously defeats separation of particles on the basis of size.
For particles of the same density the larger ones will fall fastest. For particles of the same size, the densest ones will fall fastest. Where differences in density are substantial a desired separation by classification is best suited to a somewhat coarser, more evenly sized ground ore. The product of a rod mill may be suitable here.
Free settling involves a rather dilute slurry, with a low concentration of particles. As particles fall in a more dense pulp they bump into each other. This slows settling and leads to what is called hindered settling. The system then behaves like a heavy liquid whose density is that of the pulp (water plus solids). Now resistance to fall is mainly due to turbulence. For spherical particles the terminal velocity is expressed as,
\[V_t = k \left[ d(D_s - D_p) \right]^{1/2}\tag{3}\]
k = proportionality constant (comprised of several physical terms).
d = particle diameter.
Ds = particle density.
Dp = density of the pulp (weighted average density of water + solids).
Ds - Dp is the effective particle density. As pulp density* increases, the effective density of the solid particles (as Ds - Dp) decreases. Now large density differences between mineral particles becomes more important in hindered settling. Take the example of quartz and galena again. For a slurry with a density of 1.5 g/mL (water has a density of 1 g/mL) what size ratio of the two materials is required for both to have the same settling rate?
\[\frac{v_{\text{t galena}}}{v_{\text{t quartz}}}= 1= k\left[d_{\text{quartz}}(2.65 - 1.5)\right]^{1/2}= k\left[d_{\ce{PbS}}(7.5 - 1.5)\right]^{1/2}\tag{4}\]
This yields
\[\frac{d_{\text{quartz}}}{d_{\ce{PbS}}}= \frac{7.5 - 1.5}{2.65 - 1.5}= 5.22\tag{5}\]
So a quartz particle 5.2 times the size of a galena particle will fall at the same rate. For free settling, the density of the fluid is the density of water. In this case,
\[\frac{d_{\text{quartz}}}{{d_{\ce{PbS}}}} = 3.94\tag{6}\]
Hence the effect of density differences between minerals is amplified by hindering settling conditions. Free settling classifiers may be used when the separation is to be based predominantly on size and density differences are relatively small. Hindered settling classifiers are employed when the density differences between particles are to be exploited. Free settling requires a lot more water. Efficiency of settling is lower in hindered settling due to the increased viscosity of the fluid (slurry). Separation based on density differences is called sorting. This employs slurries with 40-70% solids by weight. Separation on the basis of particle size is called sizing. Slurries range from 3% solids for finer particles to 35% solids for coarse particles.
*Pulp density properly refers to the density (kg/m3) of a slurry. The term is often used to refer to the % solids in a slurry. This is an unfortunate but common misuse of the term.
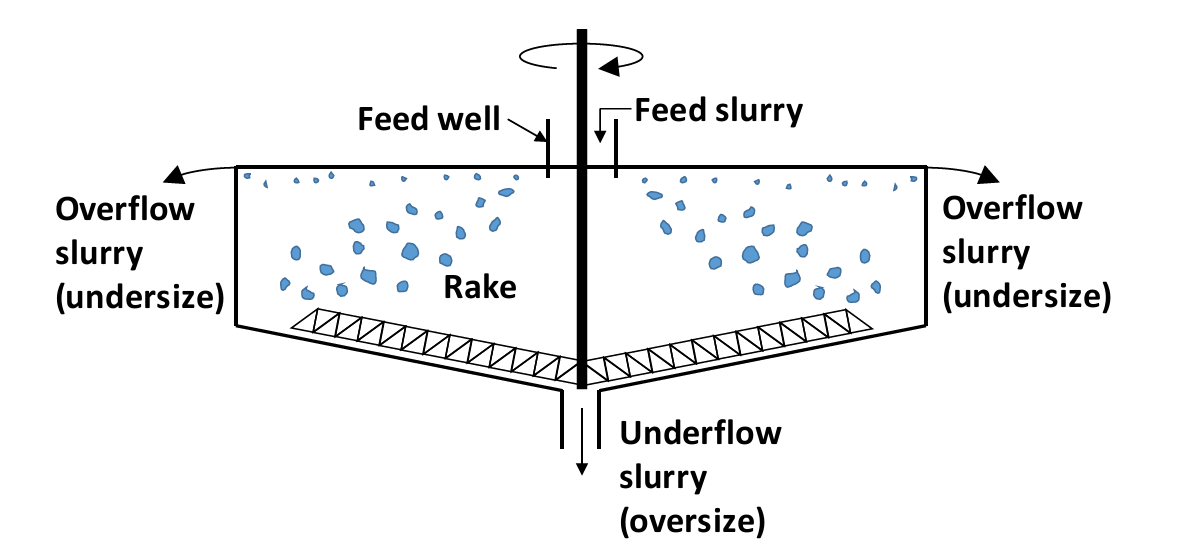
An illustration of one type of classifier is shown in Figure 3.2 (below). These are cylindrical and have a conical bottom. They may be very large (on the order of up to 100 m) and have a large capital cost. Slurry feed enters near the centre and spreads over the surface. The overflow contains the undersize particles. The larger particles fall and are directed toward a centre outlet (underflow) by a slowly rotating rake. These utilize a horizontal current or flow. A number of these are may be used in series to achieve the desired separation. There are also other types of mechanical classifiers, for instance using a large screw in an inclined trough. Rotation of the screw lifts lighter particles up toward the overflow while gravity draws heavier particles down.
Cyclones and Hydroclones
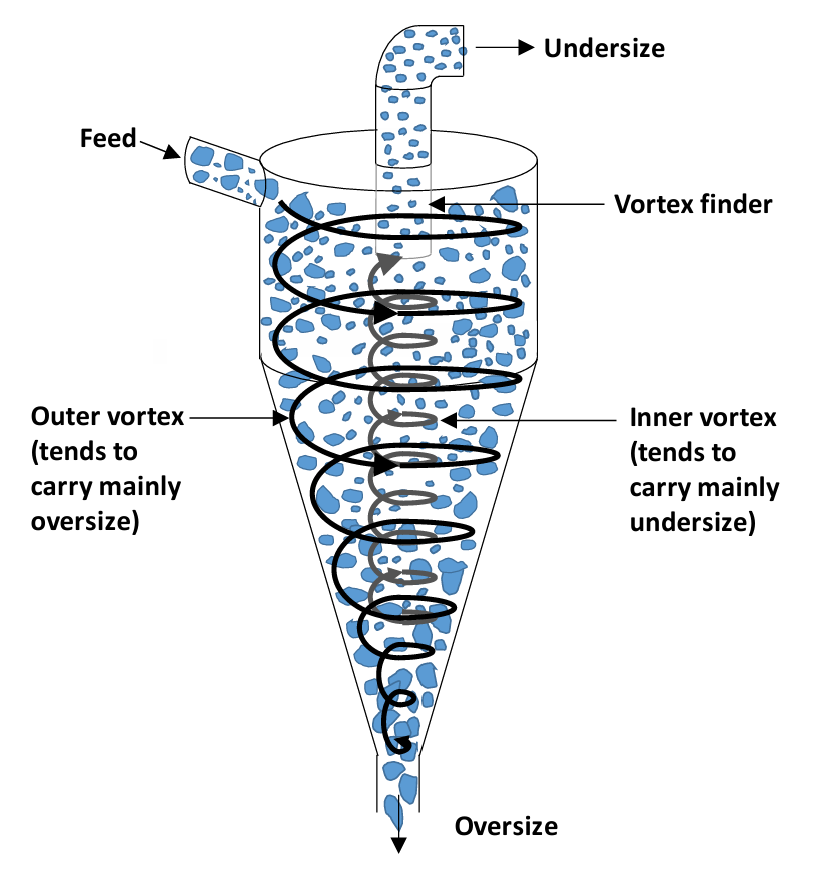
Although there are a great many types of size classifiers, many of these have been replaced by cyclones and hydroclones. They are the most prevalent size classifier in use in mineral processing. These machines use centrifugal force to increase the rate of particle segregation. Centrifugal forces of 10-4000 g may be employed, depending on the size of the machine. An illustration depicting how a cyclone (hydroclone) works is given in Figure 3.3 (below). Slurry enters the conical vessel tangentially at high rate. Heavier oversize particles stay against the wall and drop toward the bottom underflow. They follow a descending spiral path. The orbiting particles tend to be pushed toward the wall, but their movement is also impeded by drag forces. The smaller particles stay nearer the middle and tend to be drawn upwards by an inner vortex. The undersize particles exit through a central pipe at the top. This is called the vortex finder. It dips below the top of the cyclone and prevents the feed from simply exiting out the top. In a hydroclone an air core develops in the centre and the pressure in this region is quite low. In a hydroclone most of the liquid volume exits from the top. This drags the smaller particles with it. The flow pattern is complex. These machines are very efficient for separation of fine particle sizes. They find use in closed circuit grinding for separation of oversize and undersize particles, de-sliming (removal of very fine solids, called slimes), de-gritting (removal of coarse material) and thickening (which is partial removal of water from a slurry).
Hydroclones have replaced mechanical classifiers in modern grinding plants. Hydroclones are used for separations involving particles of between 5 and 150 μm. They are more efficient, especially in the fine particle range, they require less floor space, and the residence time is shorter. This may also have the added benefit of lessening the extent of oxidation of ore particles by air. Oxidation can be deleterious to downstream separation processes.
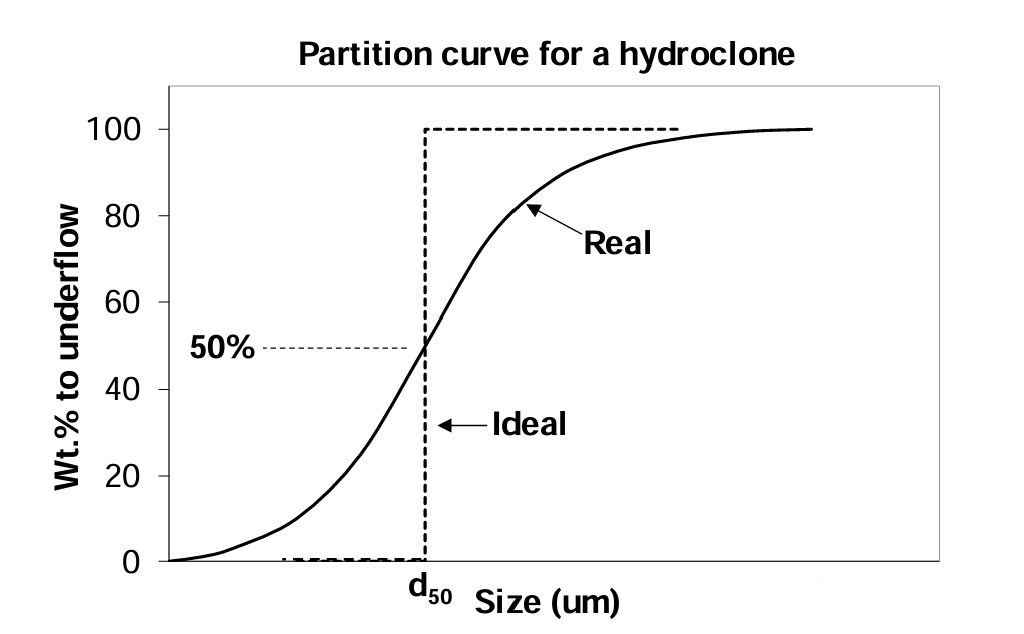
The efficiency of a hydroclone for separation of particles by size is represented by the partition curve. This is a plot of weight % of material reporting to the underflow versus size. A schematic example is shown in Figure 3.4 (below). For a perfectly efficient machine all the particles below a specified size would report to the overflow and all those above that size to the underflow. In reality, a curve is obtained. The size corresponding to the point where 50% of the mass goes to underflow and 50% to overflow is called the cutpoint or d50. Particles of this size have a 50-50 chance of reporting to either the overflow or the underflow. The steeper the slope in the vicinity of d50, the higher the efficiency.
Designers specify cyclones according to flow rates, with provision for adjustments to feed, overflow and underflow openings. The first parameter that needs to be known is the size at which the feed is to be split into oversize and undersize. This is the d50. The major factor in determining this is the cyclone diameter. A normal feed may contain up to 30% solids by weight. In closed circuit grinding operations up to 60% solids may be employed since the degree of separation
required is not very fine. Capacities of 2000 - 2 × 10⁶ m3/h are possible.
Size Reduction Circuits
Size selection has already been seen to be an integral part of closed circuit size reduction. The preceding sections have described two of the most important size selection processes (screening and cyclones/hydroclones). In addition to open circuit and closed circuit size reduction there is also single stage and two stage size reduction. For example, grinding can be done using a single type of mill (single stage grinding) or two types (two stage grinding). Some features of
these arrangements are indicated below:
Single stage:
- Less equipment (lower capital and operating costs), simpler.
- Less space required.
2-stage:
- Less overgrinding (greater flexibility and control).
- May allow for a simpler fine crushing plant (e.g. cone crushing; provides feed to the grinding plant).
- The capacity of an already existing single-stage grinding plant can be increased by addition of a second stage.
- Allows opportunity for recovery of desired ore material in between stages. Improves efficiency of throughput.
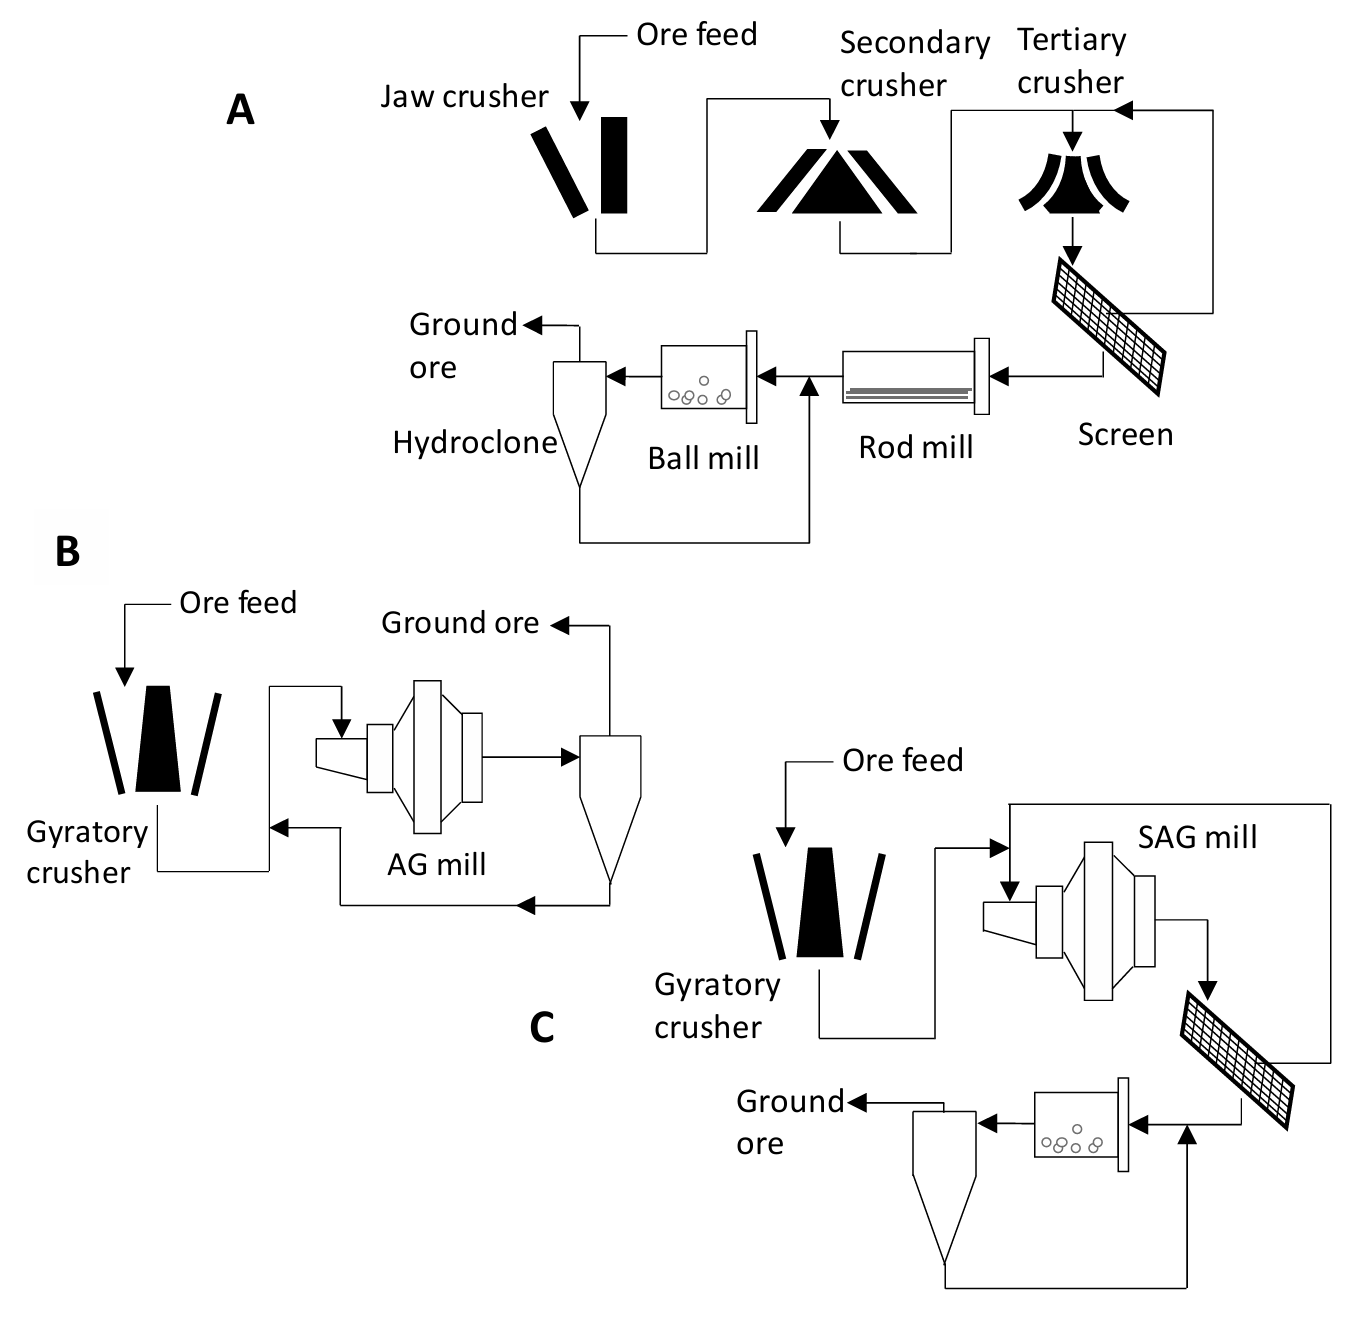
Crusher output particle size is not strongly dependent on input feed size. However, the output size from grinding mills is highly dependent on feed size because the output size depends critically on residence time in the mill. Hence screening of the final crushing plant product can help provide a more consistent feed to the grinding circuit. To get closely sized ground ore from a ball mill, AG mill and a SAG mill (where applicable; SAG mills may produce coarser material than an AG mill; AG mills are not common) closed circuit grinding is required.
Some illustrative examples of size reduction flowsheets are presented in Figure 3.5 (below). There are numerous variations. In Figure 3.5 (A) (below) there is an illustration of a two stage grinding circuit. Another way to use the same equipment to potentially better effect is shown in Figure 3.5 (below). This too is a two-stage grinding circuit, but the cyclone/hydroclone is placed between the rod mill and the ball mill, rather than after the ball mill as in Figure 3.5 (A) (below). The potential benefit of this arrangement is that output from the rod mill that is below the desired maximum size is removed as product without having to go through the ball mill. (Rod mill product may be more closely sized than ball mill product, but a size distribution is still produced.) This lessens overgrinding and allows greater throughput (or a smaller ball mill) since some rod mill product is removed ahead of the ball mill. The ball mill product is size classified through the same cyclone/hydroclone.
Criteria that influence design of size reduction circuits include:
- Mill product specification (size range).
- Ore characteristics such as energy consumption for size reduction, feed size, variations in mineral hardness, etc.
- Optimization of energy efficiency (size reduction consumes a lot of energy).
- Minimization of capital cost.
- Production rate.
*add quiz*
Media Attributions
- Ch2_F18_Screen_Blinding © Bé Wassink and Amir M. Dehkoda is licensed under a CC BY-NC (Attribution NonCommercial) license
- Ch2_F19_Settler_Size_Classifier © Bé Wassink and Amir M. Dehkoda is licensed under a CC BY-NC (Attribution NonCommercial) license
- Ch2_F20_Hydroclone © Bé Wassink and Amir M. Dehkoda is licensed under a CC BY-NC (Attribution NonCommercial) license
- Ch2_F21_Partition_Curve_Hydroclone © Bé Wassink and Amir M. Dehkoda is licensed under a CC BY-NC (Attribution NonCommercial) license
- Ch2_F22_Size_Reduction_Circuits © Bé Wassink and Amir M. Dehkoda is licensed under a CC BY-NC (Attribution NonCommercial) license
A mixture of solution and solids. This is the state of an ore plus solution during and at the end of leaching. Complete dissolution does not occur.
