Answers to Post-Reading Questions
Chapter 1. Introduction to Chemical Analysis
Question 1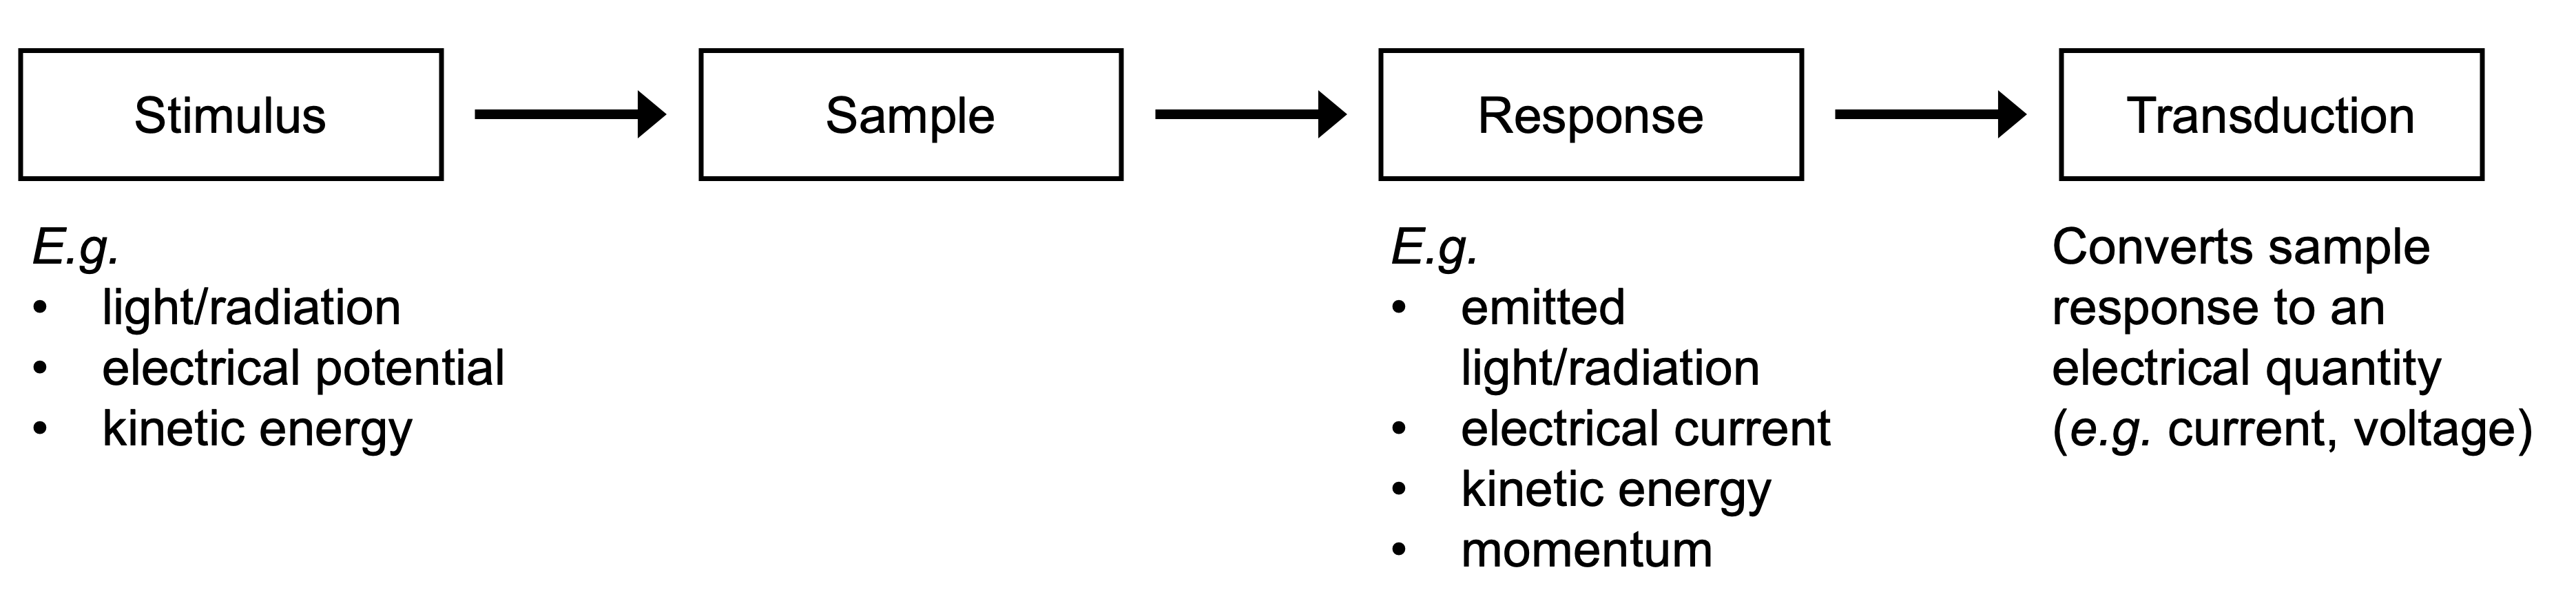
Question 2
Transduction does not produce a voltage or current that is easily related to the quantity of analyte. Calibration establishes an empirical, rather than a theoretical, relationship between the analytical response and the quantity of analyte that caused that response.
Question 3
Limit of detection (LoD): The smallest amount of analyte that can be readily detected.
Dynamic range: The range over which the instrument response changes predictably and significantly with changes in the quantity of analyte.
Sensitivity: The change in signal vs. change in quantity of analyte (e.g. the slope of a linear calibration curve).
Selectivity: The degree to which a method of analysis is sensitive to the analyte versus other species in the sample matrix.
Signal-to-noise (S/N) ratio: The ratio between the average value of the output signal and its variation between replicate measurements.
Signal-to-background (S/B) ratio: The ratio between the average value of the output signal in response to analyte and the output signal in the absence of analyte.
Chapter 2. Properties of Light
Question 1
The photons in the green laser beam have more energy than the photons in the red laser beam because they have a shorter wavelength (i.e. higher frequency).
Question 2
Because the refractive index increases, the wavelength of the red laser beam will be shorter within a BK7 glass lens than through air.
Question 3
No, this observation implies that leaves absorb red light (complimentary to green) most strongly.
Question 4
The angle should be 45°. The angle of incidence equals the angle of reflection, such that 2 × 45° = 90°.

Question 5
Refraction
Question 6
No, the width of the slits needs to be similar in size as the light passing through. Diffraction would not be anticipated until the slit width was on the order of microns.
Chapter 3. Light Sources
Question 1
Question 2
Chapter 4. Wavelength Selection
Question 1
Entrance slit, grating, and exit slit.
Question 2
The relative angle of the grating determines the center wavelength output by the monochromator.
The slit width and dispersion of the grating determine the range wavelength(s) output from the monochromator.
Question 3
Grating: diffraction
Prism: refraction
Question 4
Chapter 5. Photodetectors
Question 1

Question 2

Question 3

Chapter 6. UV-Visible Absorption
Question 1
Yes
Question 2
The energy difference between the S0→S2 electronic states is larger than for S0→S1. S0→S2 transitions therefore occur at shorter wavelengths (i.e. higher energy) than S0→S1 transitions.
Question 3
A(λ) = −log[P(λ)/P0(λ)] = ε(λ)bc
A is absorbance, P is the intensity of light of wavelength λ transmitted through the sample, P0 is the intensity of light of wavelength λ incident on the sample, ε is the molar absorption coefficient of the molecule at wavelength λ, b is the path length of light through the sample, and c is the concentration of the molecule.
Question 4
Concentration is given in units of M and path length is given in units of cm.
Question 5
A = –log(P/P0) = –log(0.72/7.2) = –log(0.10) = 1.0
It can be handy to remember that the light intensity is attenuated 10-fold for every unit of absorbance. A = 1 is a ten-fold attenuation, A = 2 is a hundred-fold attenuation, and so on.
Question 6
c =[A(λ)]/[ε(λ)b] = 0.15/[(150 000 M-1 cm-1)(1.0 cm)] = 1.0 x 10⁻⁶ M or 1.0 µM
Chapter 7. UV-Visible Spectrophotometers
Question 1
The cuvette must be transparent to the wavelength (or over the wavelength range) being measured.
Different cuvette materials have different costs and robustness.
Question 2
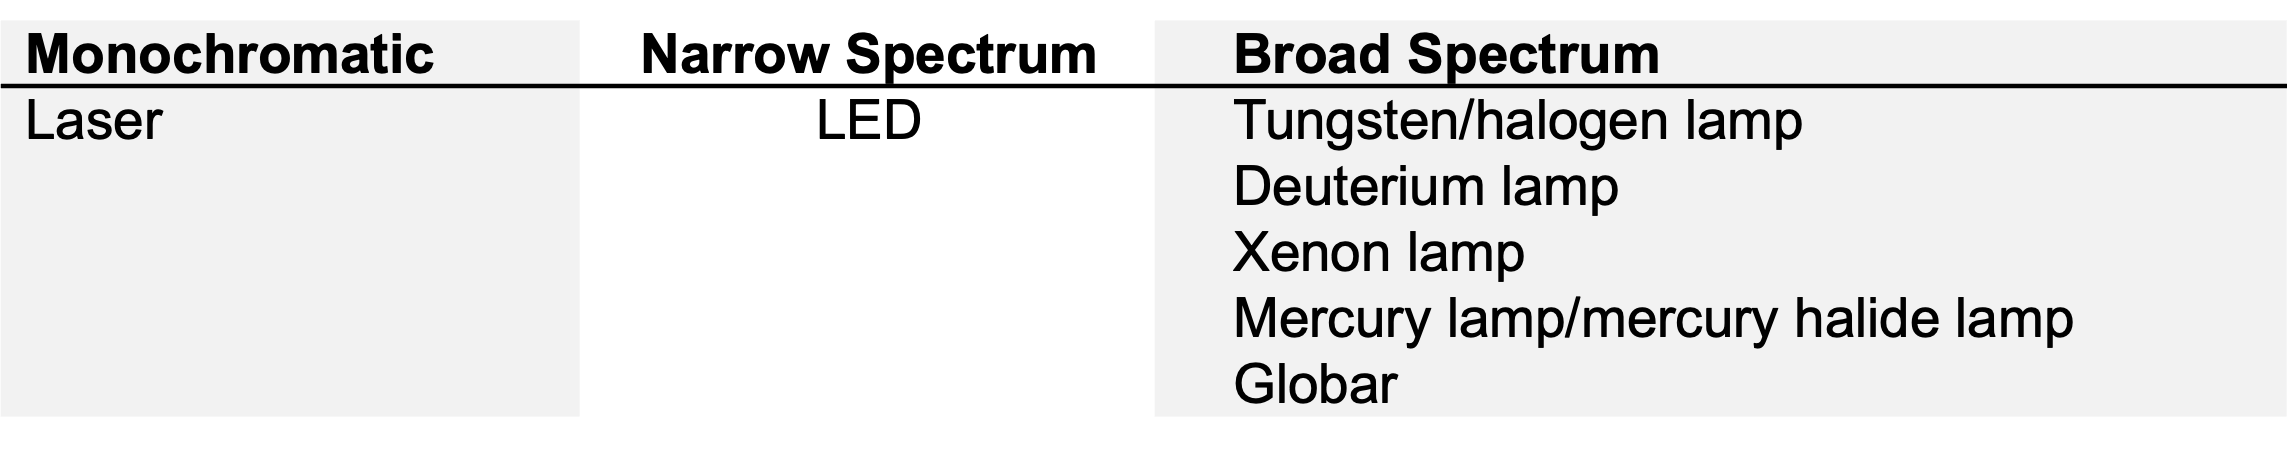
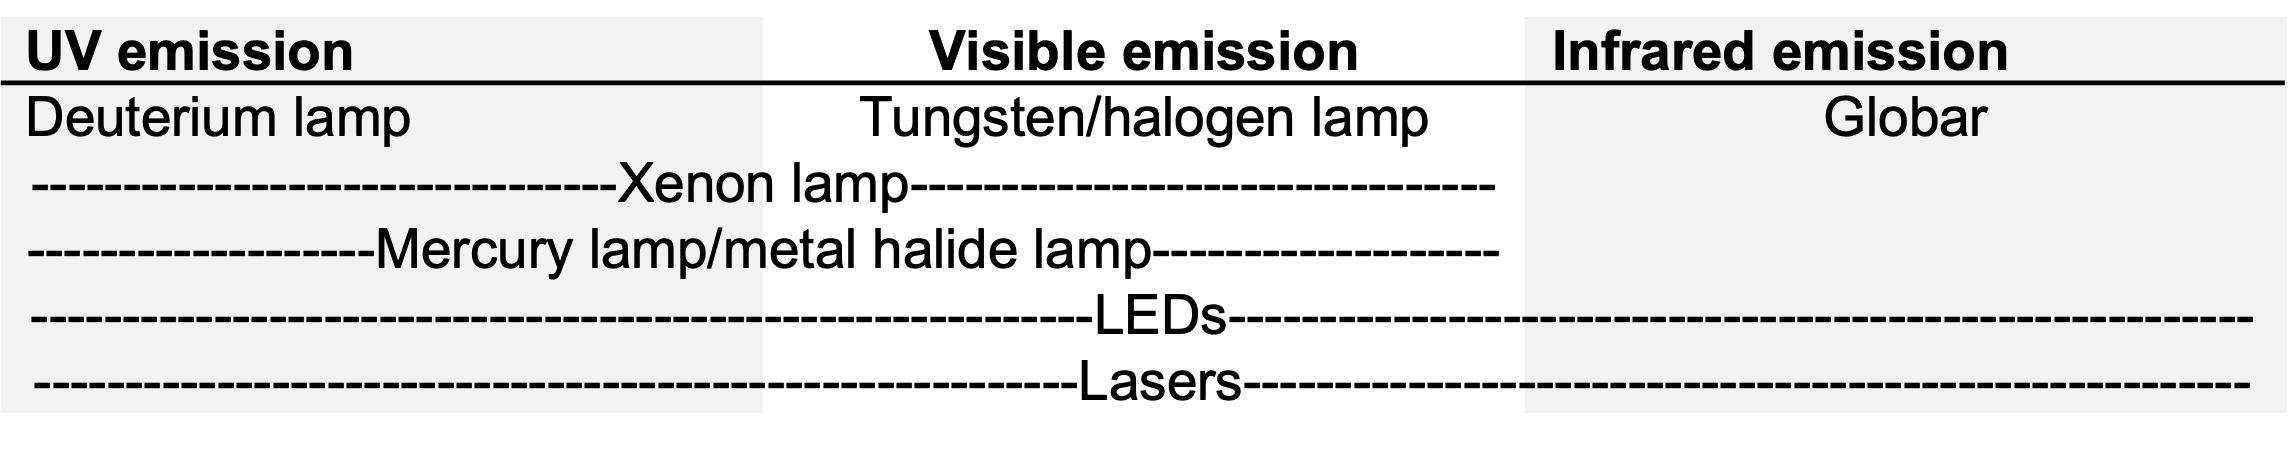
Emission from a xenon lamp is significant across both the UV and visible spectral regions.
A tungsten-halogen lamp emits mainly visible light and a deuterium lamp emits mainly UV, such that the two lamps must be combined to cover both spectral regions.
Question 3
Double-beam spectrophotometers more reliably measure higher and lower absorbance values than single-beam spectrophotometers.
Double-beam spectrophotometers have superior precision.
Question 4
Acquires full spectra rapidly
More robust design (no/fewer moving parts)
Enables more compact designs
Question 5
Wavelength selection.
Control of spectral bandwidth (i.e. range of wavelengths) and resolution.
Chapter 8. Molecular Fluorescence
Question 1
Φ = 0.50 = (photons emitted)/(photons absorbed)
Φ = 0.50 = (1000)/(photons absorbed)
Photons absorbed = 2000
Question 2
Stokes’ shift = emission peak wavelength – absorbance peak wavelength
22 nm = emission peak wavelength – 598 nm.
Emission peak wavelength = 620 nm
Question 3
Kasha’s rule states that fluorescence emission almost always occurs from S1v0 because of the rapid non-radiative conversion of higher-order electronic states (S2) to the S1 state.
Yes, the shape of the emission spectrum is the same regardless of excitation wavelength. Per Kasha’s rule, emission occurs from the same state (S1v0) regardless of the state to which a molecule is initially excited.
Question 4
Fluorescence occurs within hundreds of picoseconds to tens of nanoseconds after excitation.
Phosphorescence tends to occur within microseconds to minutes.
Since the timescale is on the order of nanoseconds, the likely mechanism of emission is fluorescence.
Note: As you might learn in lecture, the time to reach 37% (i.e. 1/e) of the initial intensity after pulsed excitation is a quantity called the fluorescence lifetime.
Chapter 9. Measurement of Fluorescence
Question 1
The fluorescence excitation spectrum will be analogous in that it will have the same shape and spectral position as the absorbance spectrum.
Question 2
A spectrofluorometer requires excitation and emission monochromators to select the excitation and emission wavelength(s) of interest. That is, the input wavelength is not the same as output wavelength, so two separate monochromators are needed.
A spectrophotometer requires just one monochromator because only the intensity of transmitted light is measured.
Question 3
The L-shaped path minimizes background due to stray excitation light because reflections and scattering are minimized at a right angle to the incident light.
Fluorescence emission is isotropic, such that an L-shape path does not affect how efficiently fluorescence is detected.
Question 4
The trend is linear at low sample concentrations, then plateaus (or starts to decrease) at high sample concentrations.

Question 5
The terms in Eqn. 9.1 are parameters that can be optimized to maximize fluorescence signal:
- Higher sample concentration
- Longer path length
- More intense excitation light
- Selection of the excitation wavelength with the highest molar absorption coefficient
- Selection of the emission wavelength with highest contribution to the total fluorescence emission
- Components or designs that increase the instrument efficiency (e.g. more sensitive detectors)
Chapter 10. Atomic Absorption and Emission
Question 1
Elements
Question 2
Unlike molecules, atoms do not have vibrational and rotations states. Transitions in atoms are therefore purely electronic.
Question 3
At 589.0 and 589.6 nm.
Question 4
For atomic spectroscopy, the sample is required to be in the gaseous atomic state. Samples are typically solid or liquid, with most of the matter in a non-atomic (e.g. molecular) state. During atomization, heat (i.e. energy) is applied to convert a molecular or other condensed-phase sample into a gaseous atomic population.
Question 5
The Boltzmann distribution.
Chapter 11. Atomic Spectroscopy
Question 1
Flames have enough energy to atomize the sample, but, for many elements, inadequate energy to excite an atomic population efficiently.
Question 2
0.004 nm/0.2 nm = 0.02 = 2%
Question 3
The light from the flame would cause an atomic absorbance reading to be incorrectly low (i.e. adds extra light), while soot would cause an atomic absorbance reading to be incorrectly high (i.e. absorbs or scatters light).
Question 4
The light measured comes from atoms that are thermally excited. By definition, fluorescence is emission of light following excitation via the absorption of light. Light absorption is not part of the process for atomic emission spectroscopy. (Note: atomic fluorescence spectroscopy does exist, but is relatively uncommon.)
Question 5
AAS is recommended because of its lower cost, and because the lesser versatility of AAS will not be problematic if the company needs to measure only three elements.
Chapter 12. Infrared Absorption
Question 1
The fundamental transition.
Question 2
6.06 µm
Question 3
5668 cm–1
Due to anharmonicity, the first overtone will be a little less than double the wavenumber of the fundamental.
Question 4
Using the group frequency region:
- Advantage: peaks are most easily linked to specific bond types and functional groups in an analyte structure.
- Disadvantage: lack of structural specificity (i.e. not enough detailed information about the analyte(s) overall structure).
Using the fingerprint region:
- Advantage: provides a unique pattern for a given analyte molecule.
- Disadvantage: the many absorption peaks are challenging to correlate to specific functional groups and interpretation often requires computer assistance.
Question 5
The symmetric stretching vibration of carbon dioxide produces no change in net dipole as the opposing motions of each C=O bond cancel out one another. In the asymmetric vibration, one oxygen atom moves away from the carbon atom while the carbon and other oxygen atoms move closer to one another, resulting in changes in the net dipole moment as the bonds vibrate.
Chapter 13. FTIR Spectroscopy
Question 1
0
An FTIR instrument uses a Michelson interferometer, which includes neither a grating nor slits.
Question 2
- FTIR spectrometers use a Michelson interferometer instead of a monochromator or polychromator.
- FTIR spectrometers uses an IR light source (e.g. globar), whereas UV-visible spectrophotometers use UV-visible light sources (e.g. xenon lamp).
- FTIR spectrometers use IR-sensitive detectors (e.g. MCT detector), whereas UV-visible spectrophotometers use UV-visible-sensitive detectors (e.g. PMT).
- FTIR spectrometers tend not to use sample cells/holders made from glass or quartz or plastic, whereas UV-visible-spectrophotometers mainly use these materials for sample cells.
Question 3
- Multiplex of Fellgett advantage (improve signal-to-noise ratio by averaging many rapidly-acquired scans).
- Throughput or Jacquinot advantage (no grating or slits, so light throughput is higher and yields superior signal-to-noise ratios).
- Higher spectral resolution is easily achieved by moving the interferometer mirror farther.
- Greater mechanical simplicity and robustness.
Question 4
Glass has strong IR absorption.
Chapter 14. Raman Scattering
Question 1
- Rayleigh scatter: 532 nm
- Stokes Raman: 556 nm
- Anti-Stokes Raman: 508 nm
Question 2
The anti-Stokes Raman peaks are less intense than the Stokes Raman peaks; the Rayleigh scatter peak is much more intense than the Raman peaks.
Question 3
When illuminated with a new 785 nm laser, the peak intensity will decrease.
The Raman shift (measured in wavenumbers) will not change.
Chapter 15 Raman Spectroscopy
Question 1
[latex]\bar{ν}_{\text{incident}} = \frac{1}{\lambda (\text{cm})} = \frac{1}{532 \times 10^{-7} \text{ cm}} = 18796.99 \text{ cm}^{-1}[/latex]
[latex]\bar{ν}_{\text{Raman}} = \bar{ν}_{\text{incident}} - \text{Raman Shift} = 18796.99 \text{ cm}^{-1} - 400 \text{ cm}^{-1}[/latex]
[latex]\bar{ν}_{\text{Raman}} = 18396.99 \text{ cm}^{-1}[/latex]
[latex]\lambda_{\text{Raman}} = \frac{1}{\bar{ν}_{\text{Raman}}} = \frac{1}{18396.99 \text{ cm}^{-1}} = 543.6 \text{ nm}[/latex]
Question 2
400 cm-1 (The Raman shift, when measured in wavenumbers, is invariant with the interrogation wavelength).
Question 3
Stokes Raman scatter is affected by background fluorescence. Fluorescence must always be at equal or longer wavelength than the interrogation light.
Question 4
- Raman scattering is inefficient. Lasers provide a high intensity of incident photons to generate a measurable number of Raman-scattered photons.
- Raman shifts are small. Lasers are monochromatic and make it easier to resolve Raman peaks from Rayleigh scatter.
Question 5
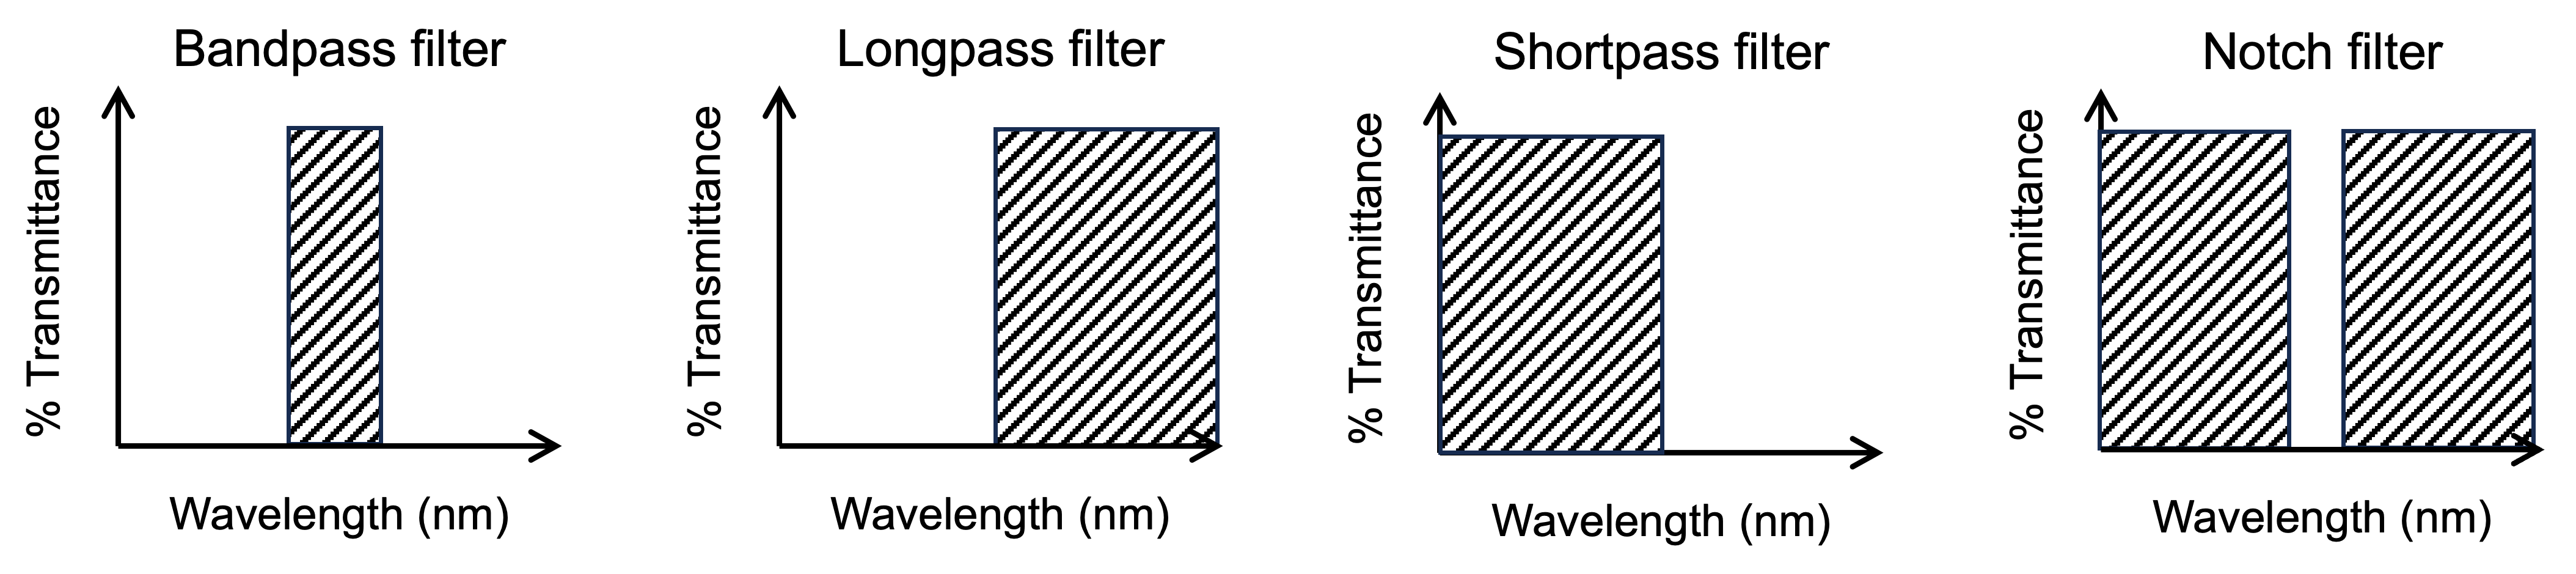
Notch filter. This filter greatly attenuates or blocks the laser light from reaching the photodetector, but transmits Stokes or anti-Stokes shifted light from Raman scattering.
Chapter 16. Voltammetry
Question 1
- Potentiometry measures voltage whereas voltammetry measures current.
- There is negligible current during potentiometric measurements whereas there is non-negligible current during voltametric measurements.
Question 2
- Charging current
- Faradaic current
Question 3
The Fermi level is the highest energy level of the electrons in the electrode. (Officially, this definition applies at a temperature of 0 K, but it remains a conceptually useful first approximation for understating electrochemistry at room temperature.)
Question 4
0.038 V or 38 mV
Question 5
More negative than –0.726 V. (With the expectation of non-zero overpotential, exactly –0.726 V may be insufficient.)
Chapter 17. Voltammetric Methods
Question 1
- Current: working electrode + counter electrode
- Potential: working electrode + reference electrode
Question 2
Common working electrode materials include platinum, gold, carbon, and mercury.
Question 3
Common types of reference electrodes include silver/silver chloride and calomel.
Question 4
ASV with differential pulse stripping. The pre-concentration of analyte associated with ASV will provide a superior detection limit versus a simple linear sweep. The differential pulse sequence after the pre-concentration will provide a superior signal-to-background ratio, and thus a superior detection limit, versus a linear sweep after the pre-concentration
Chapter 18. Elution Chromatography
Question 1
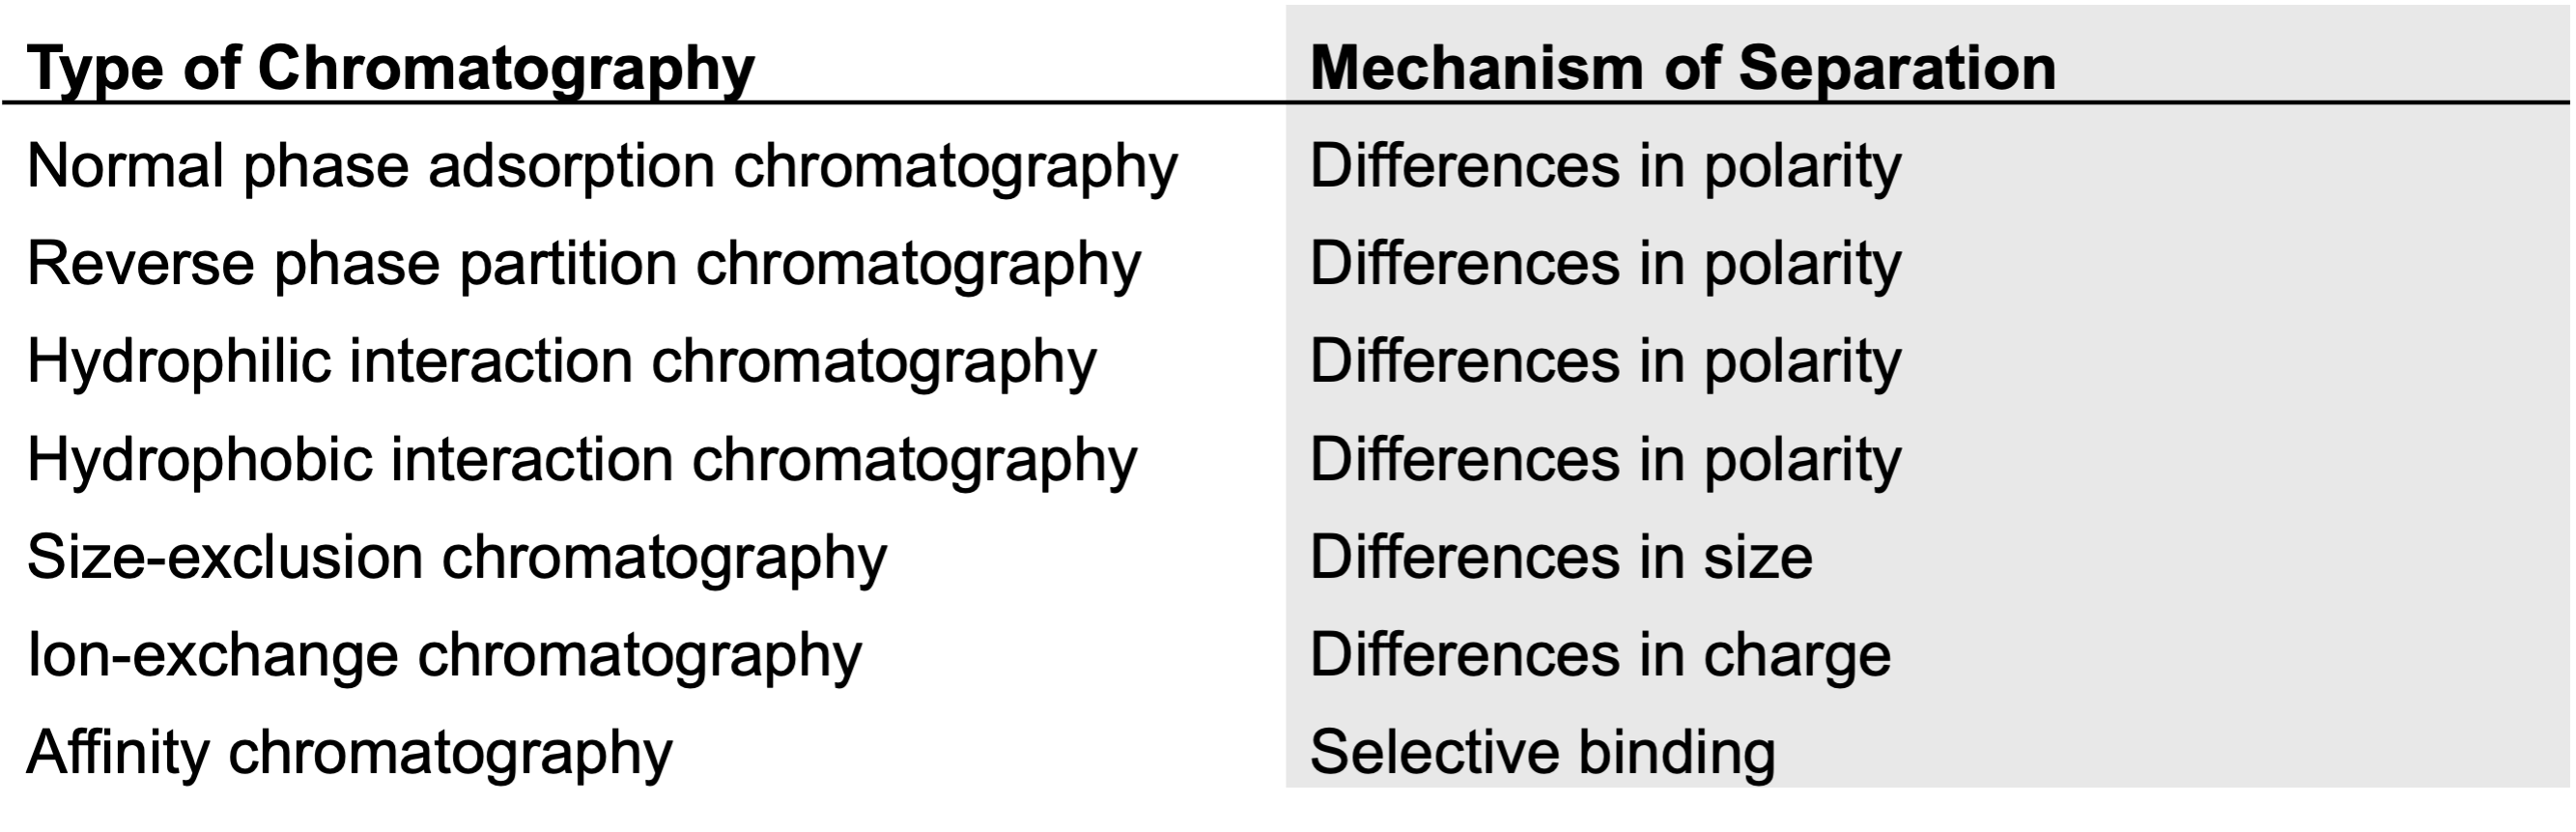
Question 2
Mixture one: RP partition
- Aspartic acid (first) < serine < alanine < phenylalanine (last)
Mixture two: ion-exchange (with anion echanger)
- Chrloride (first) < sulfate < phosphate (last)
Mixture three: size-exclusion
- Thyroglobulin (660 kDa, first) < IgG (150 kDa) < myoglobin (17 kDa, last)
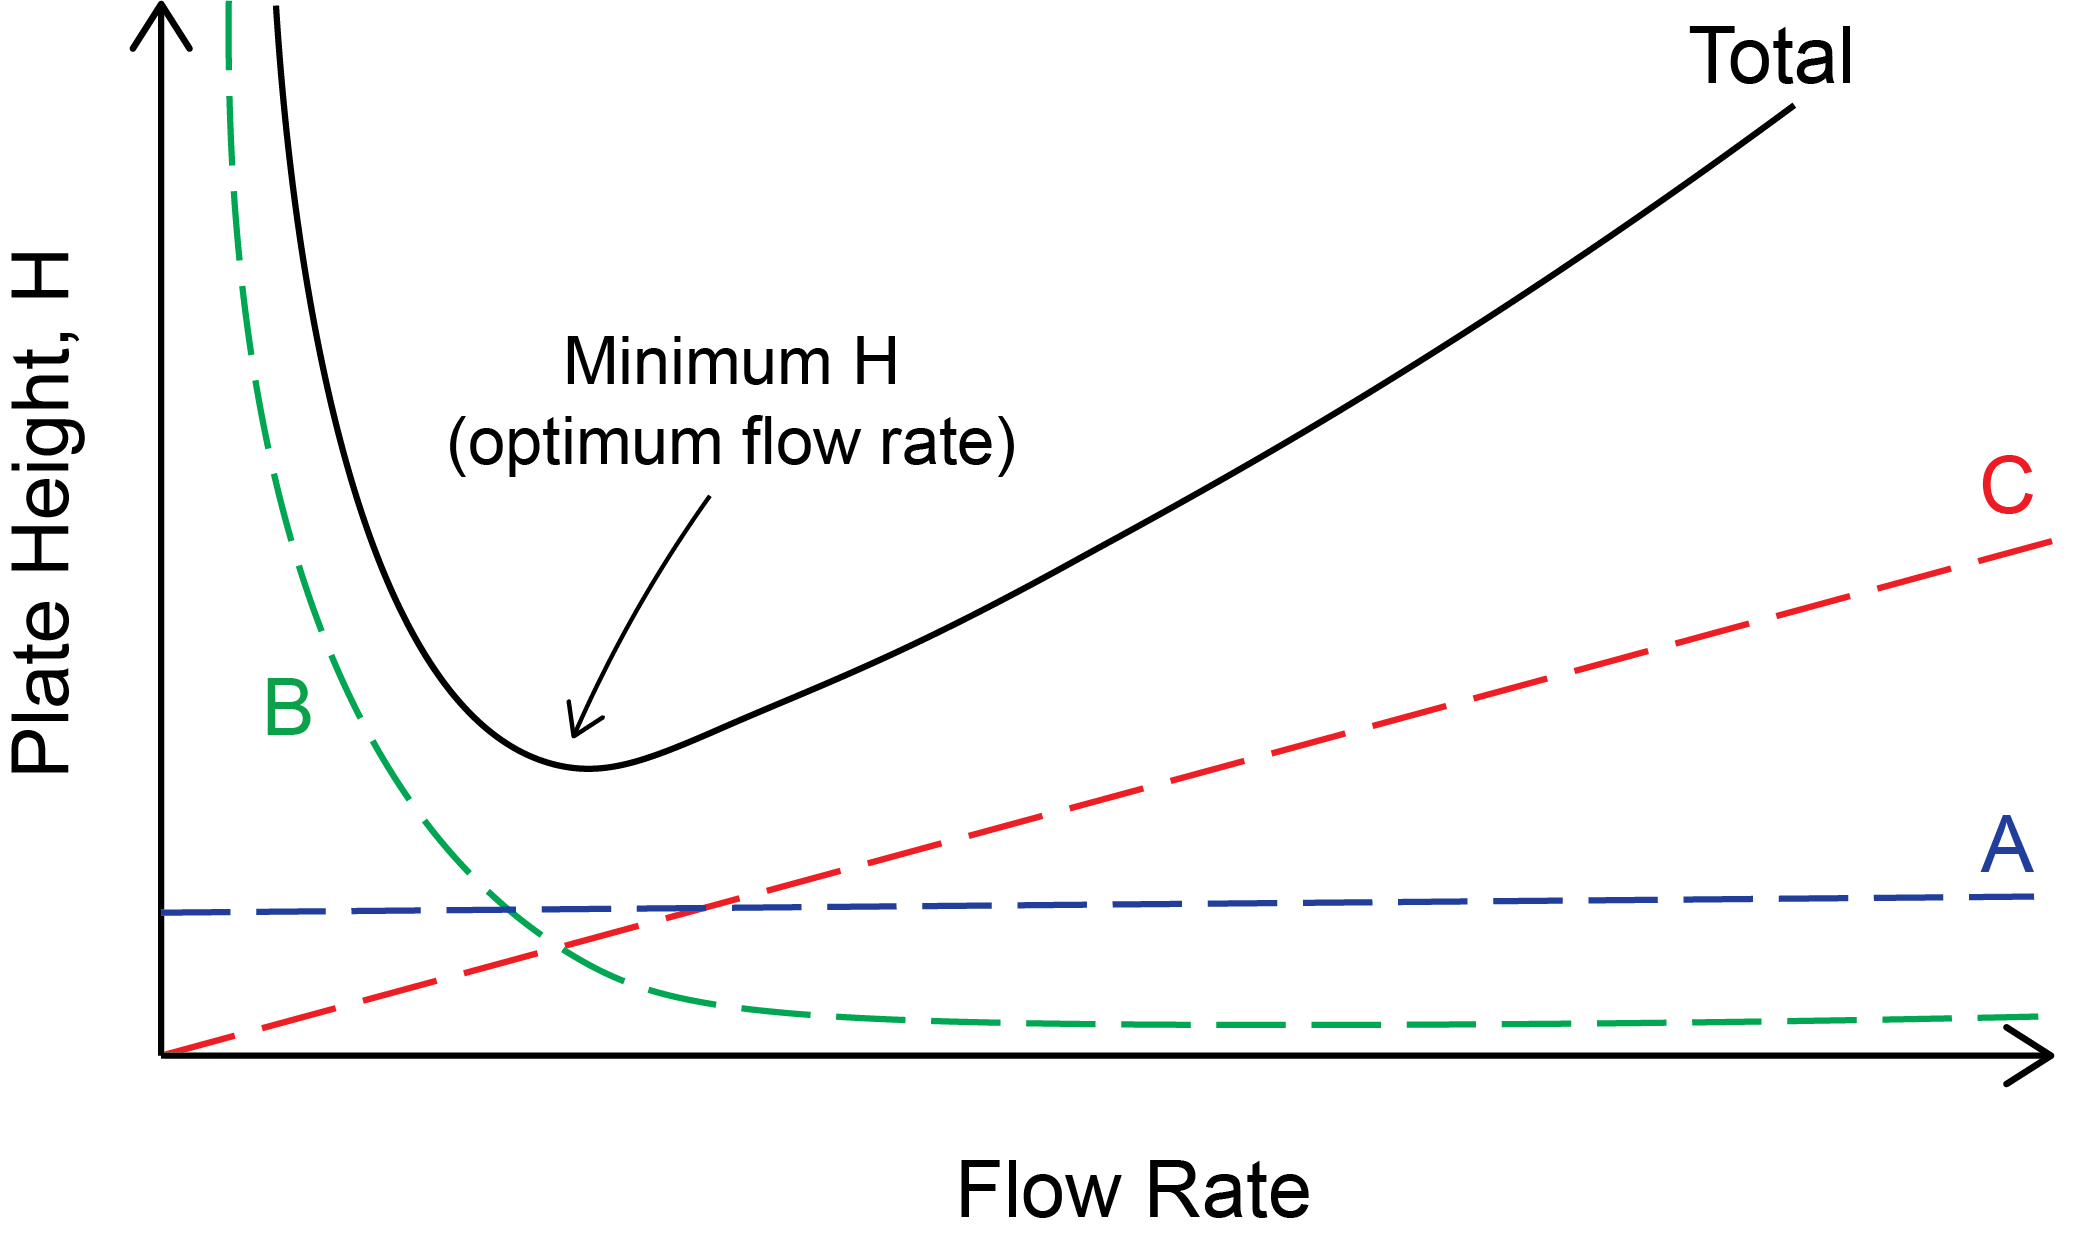
Chapter 19. Chromatograms and Separation Efficiency
Question 1
From increases in mobile phase flow rate, the A term stays constant, the B term gets smaller, and the C term gets larger.
Question 2
Partition coefficients are defined as the concentration ratio of an analyte in the stationary phase to the mobile phase. Therefore, an analyte with a larger partition coefficient will spend more time in the stationary phase and thus have a longer retention time.
Question 3
The separation efficiency decreases as the A, B, and C terms increase in magnitude.
Question 4
Question 5
When using a C18 column (i.e. a reverse phase chromatography column), the gradient elution should be programmed to gradually transition the mobile phase from water (more polar) to acetonitrile (less polar).
In general, a gradient goes from weaker eluting power to stronger eluting power.
Chapter 20. HPLC and UPLC
Question 1
Higher pressures are required for columns filled with smaller stationary phase particles.
- 2 µm stationary phase particle size: 12000 psi
- 4 µm stationary phase particle size: 6000 psi
- 10 µm stationary phase particle size: 1000 psi
Question 2
Refractive index > Absorbance > Mass Spectrometry
Question 3
- Universal: RI, ELSD, MS*
- Selective: DAD, fluorescence, electrochemistry
* Each detector has limitations, and no design is truly universal, but these three detector types are sufficiently versatile to be classified as “universal.”
Chapter 21. Gas Chromatography
Question 1
Hexane (first), octane, 1-butanol (last)
The non-polar analytes elute in order of increasing boiling point. For 1-butanol, polar interactions with the stationary phase delay its elution.
Question 2
Use a temperature gradient gradually increasing from lower to higher temperature.
Question 3
FID responds to oxidizable carbon: Propane, acetic acid, and benzene.
N2, SO2, CO2 are not oxidized further and do not produce signal.
Question 4
The high molecular weight, polar, and charged analytes best suited to SEC, IEC, HILIC, HIC and affinity chromatography are not sufficiently volatile for GC.
Chapter 25. Mass Spectrometry and Hyphenated Methods
Question 1
The chemical formula of an acetate ion is CH3COO-
m/z = exact mass/charge
[(2)(12.000000)+(3)(1.007825)+(2)(15.994915)]/(-1) = 59.013305
Question 2
- Isotopic peaks.
- Fragmentation of the molecule.
- Gas phase reactions/rearrangements of the molecule are also possible.
Question 3
Ionization source, mass analyzer, and detector.
Question 4
10-6 kPa. MS requires high vacuum.
Question 5
The technical challenge for hyphenated techniques is to go from the relatively high pressure of the LC or GC to the vacuum conditions required for the MS ion source.
Chapter 26. MS Ionization Sources
Question 1
Hard ionization methods impart enough energy that results in substantial fragmentation with little or no molecular ions.
Soft ionization methods cause minimal fragmentation with prominent molecular ions.
Question 2
Hard ionization sources: EI, SIMS
Soft ionization sources: CI, APCI, ESI, MALDI
Question 3
- APCI is performed at atmospheric pressure while CI is performed under medium vacuum.
- APCI does not utilize an electron gun.
Question 4
MALDI and SIMS.
These methods require samples to be in a solid state or surface-bound, whereas LC-MS or GC-MS require samples to be in the liquid or gas phase, respectively.
Chapter 27. Mass Analyzers
Question 1
- Electrostatic analyzer in sectors
- Ion mirror in ToF analyzers
Question 2
| Type of mass analyzer | Simplified mechanism of analysis |
| Sector analyzer | Uses a magnetic field to direct ions along a curved trajectory based on their m/z |
| Quadrupole mass filter | Separates ions by using alternating potentials to stabilize or destabilize their trajectories based on their m/z |
| Time-of-flight analyzer | Measures time required for accelerated ions to traverse a flight tube, which depends in their m/z |
| Ion trap analyzer | Traps and sequentially ejects ions based on their m/z using an electric field |
Question 3
Ion cyclotron resonance (highest) > time-of-flight analyzer > quadrupole mass filter (lowest)
Question 4
Time-of-flight analyzer (fastest) > quadrupole mass filter > sector analyzer (slowest)
Question 5
Quadrupole mass filter
Question 6
- Arrives first: Ion A
- Arrives second: Ion B
- Arrives third: Ion C
Question 7
- Most curved trajectory: Ion A
- Least curved trajectory: Ion C