2 Introduction to TB Platform
2.1 Subscription plans
In this chapter, we will provide a comprehensive overview of TB. TB is a versatile platform that caters to both personal and commercial needs, supporting a wide range of tasks such as data collection, processing, display, analysis, and device management. Furthermore, TB seamlessly integrates with popular communication protocols, including MQTT. To get started with TB, you’ll need to select a subscription plan, each offering distinct features. Essentially, you have the option to install the open-source version of TB locally on your host (Community Edition), or utilize the free cloud version for a one-month trial period. Additionally, various cloud-based subscription plans are available, tailored to suit your specific IoT solution. For a detailed breakdown of features offered in each cloud-based tier, please refer to Table 2.
Table 2. TB cloud-based subscription plans
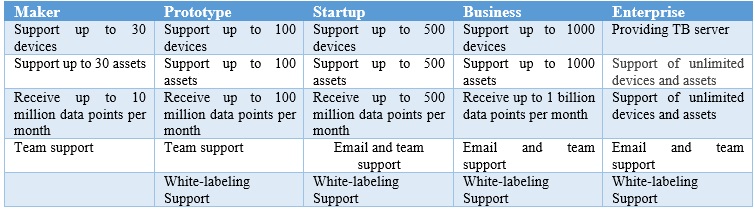
A data point in TB consists of a key-value pair, for example, {“temperature”: 42, “humidity”: 60}. Moreover, TB offers the option of white-labeling, allowing you to customize the configuration of your product and dashboard with your own logo. Furthermore, TB provides a pay-as-you-go subscription plan, enabling you to be billed based on your platform consumption. For more detailed information on the features offered in each tier of TB, please visit the official website at https://thingsboard.io/pricing/.
To start using TB in your project, you need to create an account and familiarize yourself with the different components of the platform. Here are the steps to create a free cloud-based account, known as ThingsBoard Cloud Maker:
1. Visit the TB registration page at https://thingsboard.cloud/signup.
2. Provide your information, such as a valid Gmail address, during the registration process.
3. Upon successful registration, you will be redirected to your home page, as shown in Figure 3.
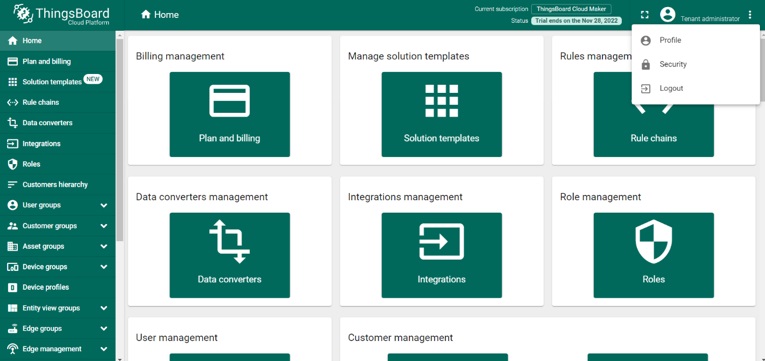
- On the left side of the home page, you will find various sections of the TB platform, including Plans and Billing, Rule chains, Integrations, Device groups, Asset groups, Widget library, and Dashboard groups. These sections allow you to access and manage different aspects of the platform.
- In the body of the home page, there are quick links that provide convenient access to different parts of the platform. Additionally, Solution templates offer prebuilt IoT projects that you can explore and utilize for your own projects.
- Your account information can be accessed from the top right corner of the home page, providing a quick way to view and manage your account settings.
To make the most of TB in your custom IoT projects, you need to define your devices within the platform. Additionally, you can add dashboard aliases in TB and place custom widgets on the dashboard to visualize and interact with your data. While other parts of the platform, such as Rule chains, are important, their detailed discussion exceeds the scope of this book.
2.2 Getting started with TB
After logging in to TB, it is important to familiarize yourself with the essential steps of the platform. Here is a breakdown of the device group section:
4. Adding device groups:
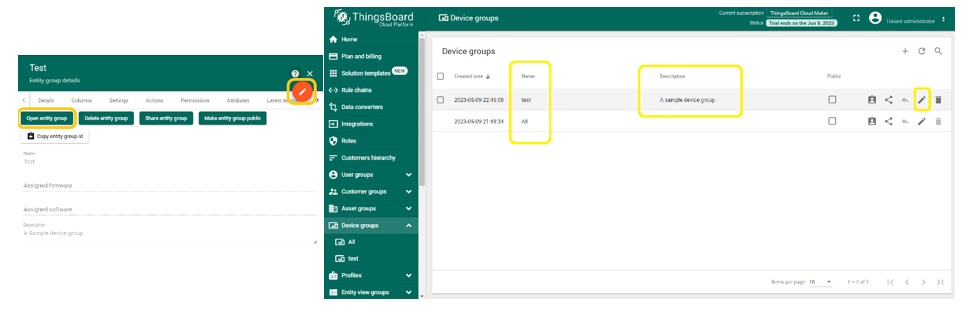
- To quickly add a custom group of devices, such as sensors, actuators, and switches, you can use the “+” icon located in the upper right corner, as shown in Figure 4. However, TB also provides a pre-defined group called “All” that includes all devices.
- When you click on the “+” icon, TB will prompt you to enter the name of the device group and provide a description. In Figure 4, we create a group named “test” with the description “A sample device group”.
5. Managing device group details:
- Once you have added a device group, you can access its details by clicking on the edit button (represented by “
 “). This allows you to perform various actions, such as managing device credentials, deleting devices from the group, and copying the group token and access password.
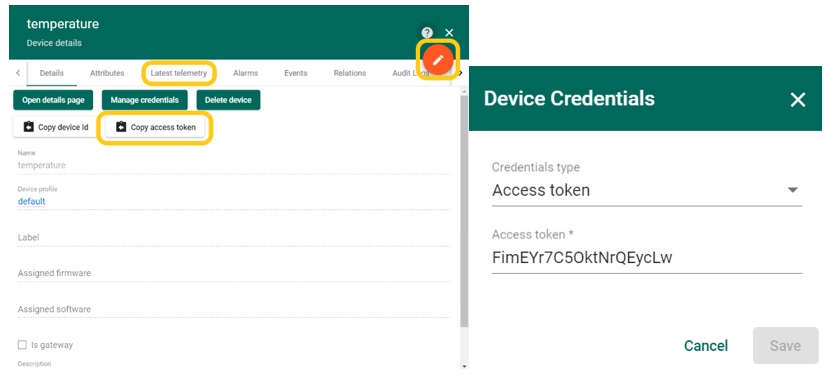
6. To define your custom device within the device group, in the device group section, click on the “+” icon located at the top right to add your device. For example, you can name your device “temperature”.
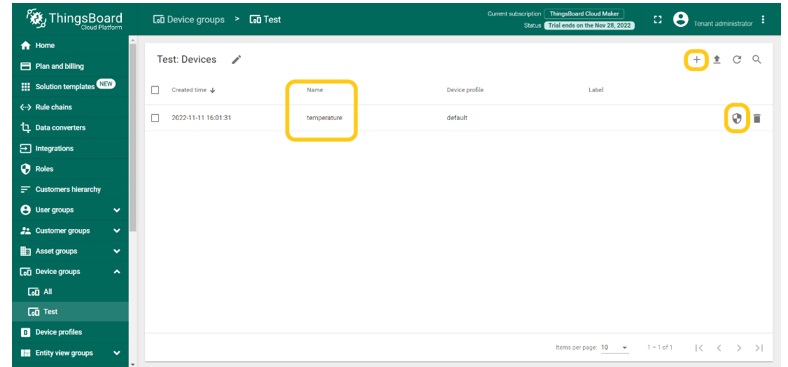
7. To access important information related to your device, click on the “![]() ” button, typically represented by an edit or settings icon. By doing so, you will be able to access the device ID or token. This token can be used as the device ID in your IoT projects.
” button, typically represented by an edit or settings icon. By doing so, you will be able to access the device ID or token. This token can be used as the device ID in your IoT projects.
8. To visualize your telemetry data in TB, you need to add dashboard groups. Start by adding dashboard groups in TB. Similar to the device group, define a name for your group and provide a description. This can be done by clicking on the appropriate button or option within the platform. Utilize the predefined group name “All” in your project, if it suits your requirements. This group allows you to easily include all relevant devices in your telemetry visualization.
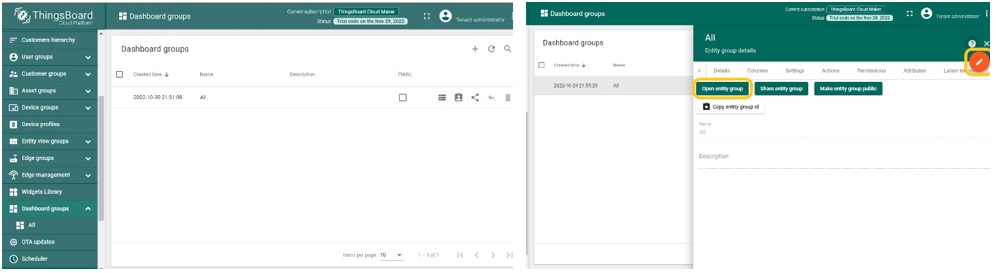
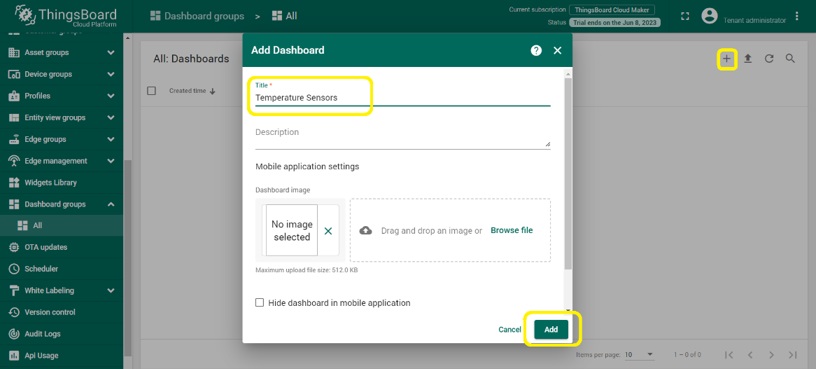
9. By clicking on the group name, a pop-up window will appear containing the details of the group. Within this window, you can click the “Open entity group” button, which will direct you to a dedicated page for adding dashboards. On this page, you can easily define and create your custom dashboard by clicking the “+” button. For example, you can name it “Temperature Sensors”. This streamlined process enables you to efficiently organize and visualize specific data within your chosen group.
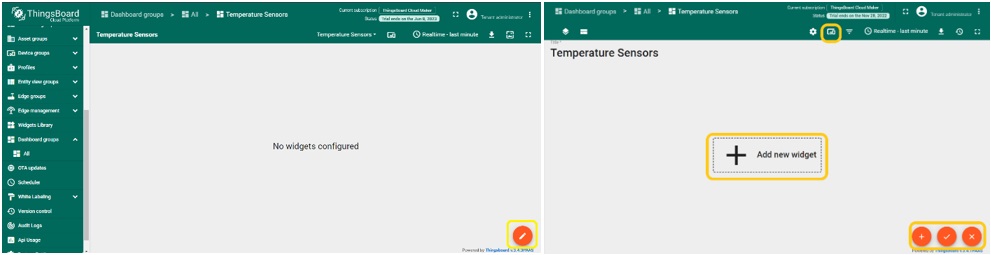
10. When you click on the title of your dashboard, it will open the dedicated page where you can add widgets and visualize telemetry data. To add widgets and configure your dashboard, you need to toggle it into editing mode. This can be easily accomplished by clicking on the edit icon, represented by “![]() “, located at the bottom right corner of the page. By enabling the editing mode, you gain the ability to add widgets and make necessary configurations to customize your dashboard according to your preferences.
“, located at the bottom right corner of the page. By enabling the editing mode, you gain the ability to add widgets and make necessary configurations to customize your dashboard according to your preferences.
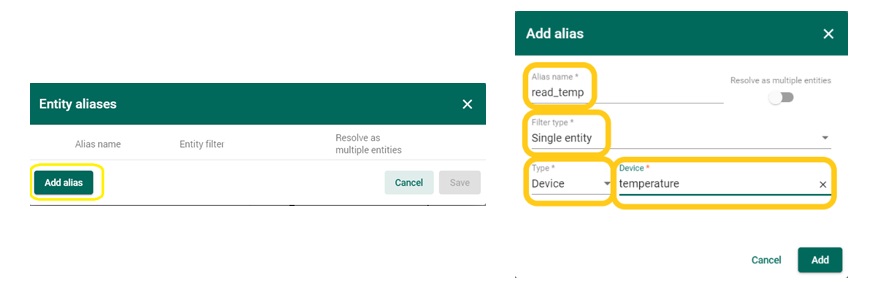
11. After entering the editing mode for your dashboard, click on the “![]() ” button located at the top right corner. This will open a window where you can enter the alias name and specify its type. By defining the “temperature” device, you can include it in the device section of your alias. This alias serves as a reference to a specific type of device or entity that can be used within widgets on your dashboard, allowing you to effectively visualize and interact with the associated data.
” button located at the top right corner. This will open a window where you can enter the alias name and specify its type. By defining the “temperature” device, you can include it in the device section of your alias. This alias serves as a reference to a specific type of device or entity that can be used within widgets on your dashboard, allowing you to effectively visualize and interact with the associated data.
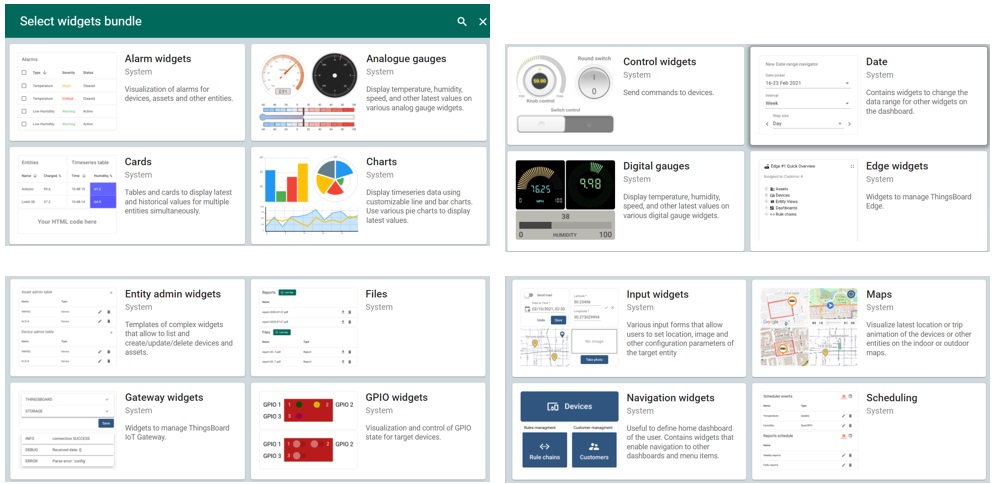
12. To add custom widgets to your dashboard, simply click on the central box or use the “![]() ” and then “
” and then “![]() ” buttons. This will open a categorized list of available widgets. You can browse through the options and select the desired widget for your dashboard. If you need more information about the widgets, you can visit the TB website’s user guide section on the widget library at https://thingsboard.io/docs/user-guide/ui/widget-library. This resource provides detailed insights into the functionality and usage of each widget, allowing you to enhance your dashboard with the appropriate visualization and interaction elements.
” buttons. This will open a categorized list of available widgets. You can browse through the options and select the desired widget for your dashboard. If you need more information about the widgets, you can visit the TB website’s user guide section on the widget library at https://thingsboard.io/docs/user-guide/ui/widget-library. This resource provides detailed insights into the functionality and usage of each widget, allowing you to enhance your dashboard with the appropriate visualization and interaction elements.
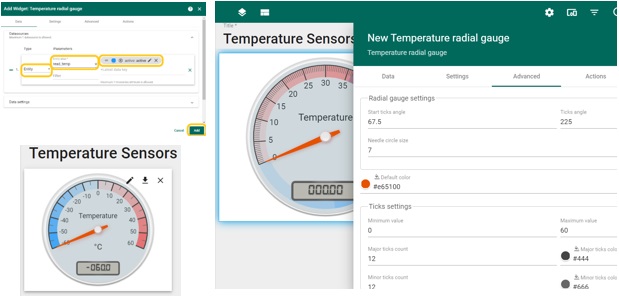
13. In order to add a widget to your dashboard, you can select one from the available options and configure it by entering the entity alias along with other required parameters. Please note that the “latest data key” parameter has not been set at this point. This parameter refers to the name of the variable that is published from the device. The process of setting the “latest data key” will be explained in the final chapter, providing you with the necessary information to configure it appropriately.
14. To ensure that your widget is successfully added and all changes are applied correctly, it is important to click the “Apply changes” button (![]() ) located in the bottom-right corner of the dashboard page.
) located in the bottom-right corner of the dashboard page.
TB offers a wide range of features, including the ability to set alarms via SMS, email, or phone. Although discussing these features is beyond the scope of this chapter, readers can visit the TB website for more comprehensive documentation.
