61 Graphs of Functions
Learning Objectives
By the end of this section, you will be able to:
- Use the vertical line test
- Identify graphs of basic functions
- Read information from a graph of a function
Before you get started, take this readiness quiz.


Use the Vertical Line Test
In the last section we learned how to determine if a relation is a function. The relations we looked at were expressed as a set of ordered pairs, a mapping or an equation. We will now look at how to tell if a graph is that of a function.
An ordered pair  is a solution of a linear equation, if the equation is a true statement when the x– and y-values of the ordered pair are substituted into the equation.
The graph of a linear equation is a straight line where every point on the line is a solution of the equation and every solution of this equation is a point on this line.
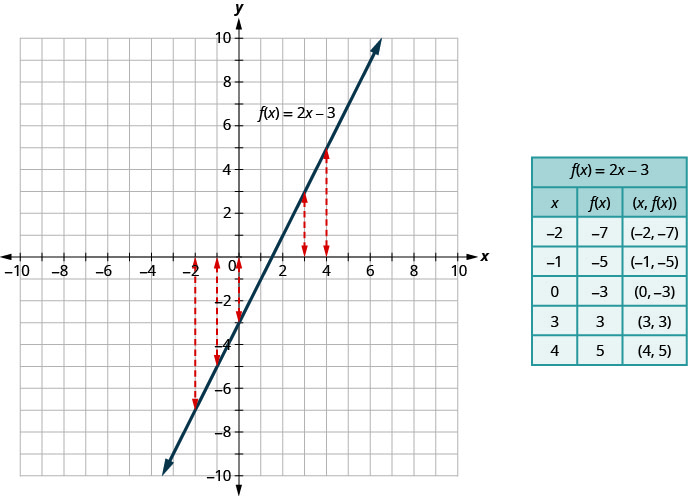
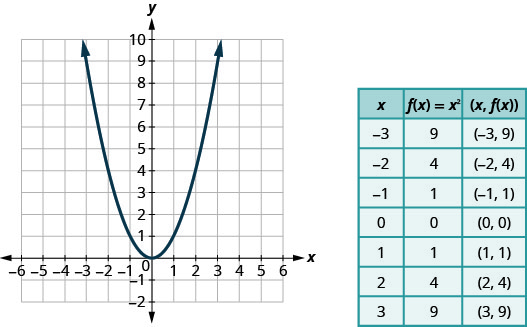
In (Figure), we can see that, in graph of the equation  for every x-value there is only one y-value, as shown in the accompanying table.
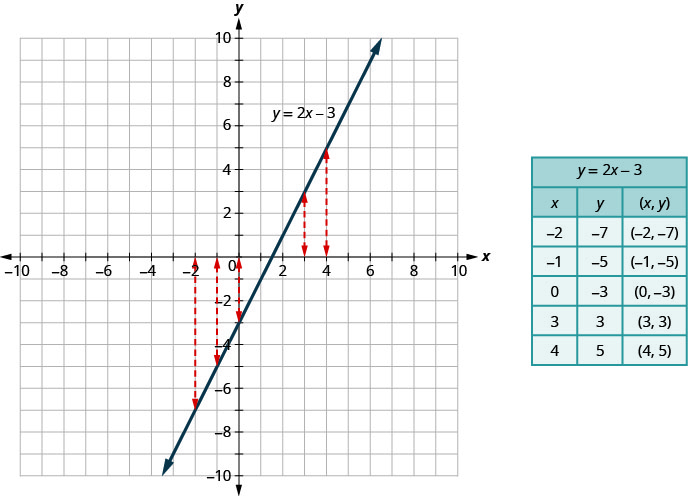
A relation is a function if every element of the domain has exactly one value in the range. So the relation defined by the equation  is a function.
If we look at the graph, each vertical dashed line only intersects the line at one point. This makes sense as in a function, for every x-value there is only one y-value.
If the vertical line hit the graph twice, the x-value would be mapped to two y-values, and so the graph would not represent a function.
This leads us to the vertical line test. A set of points in a rectangular coordinate system is the graph of a function if every vertical line intersects the graph in at most one point. If any vertical line intersects the graph in more than one point, the graph does not represent a function.
A set of points in a rectangular coordinate system is the graph of a function if every vertical line intersects the graph in at most one point.
If any vertical line intersects the graph in more than one point, the graph does not represent a function.
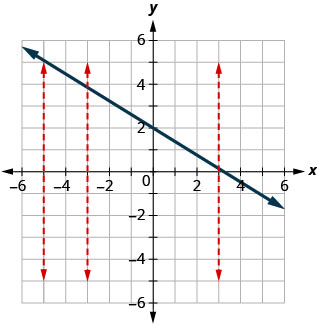
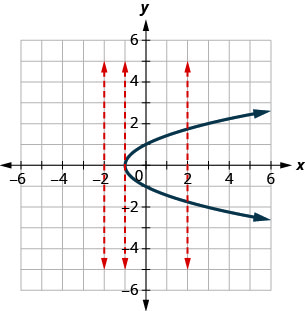
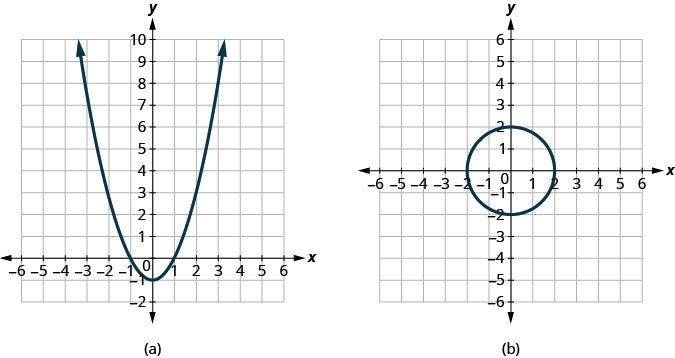
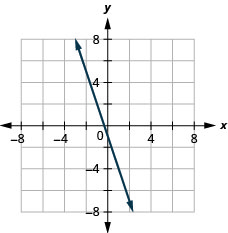
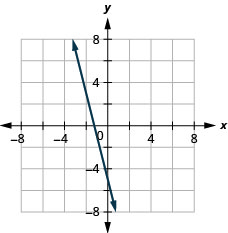
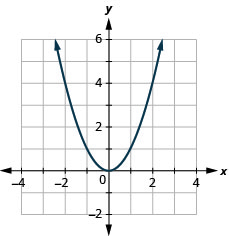
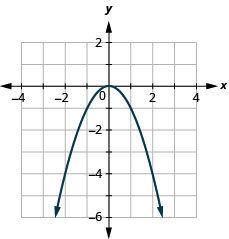
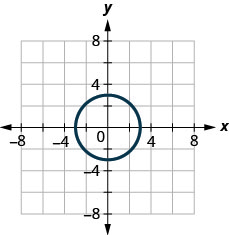
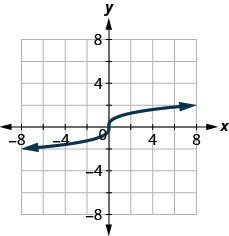
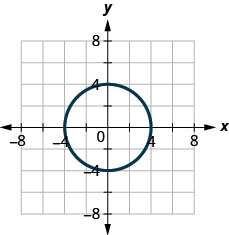
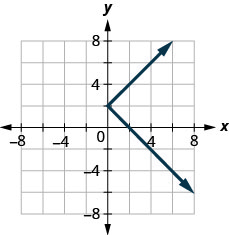
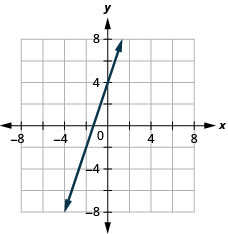
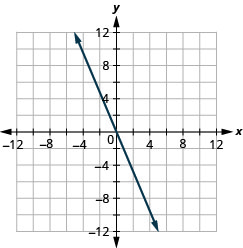
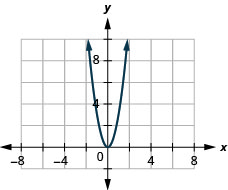
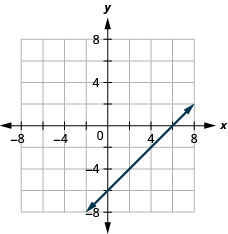
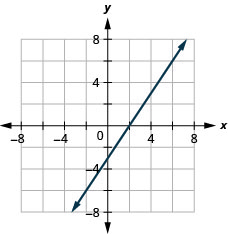
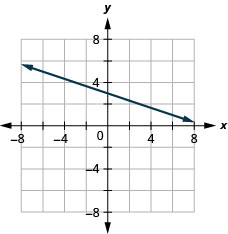
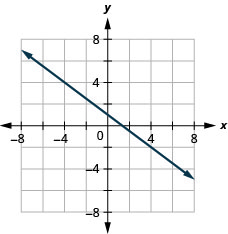
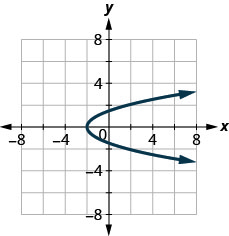
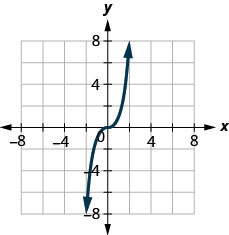
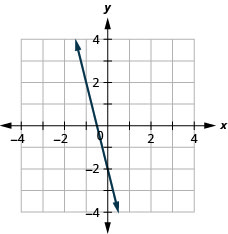
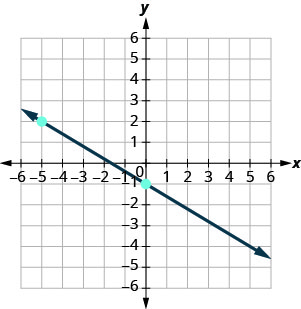
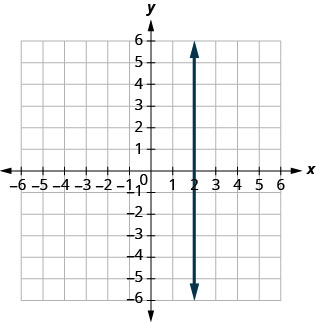
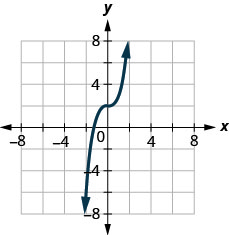
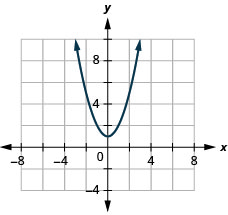
Determine whether each graph is the graph of a function.
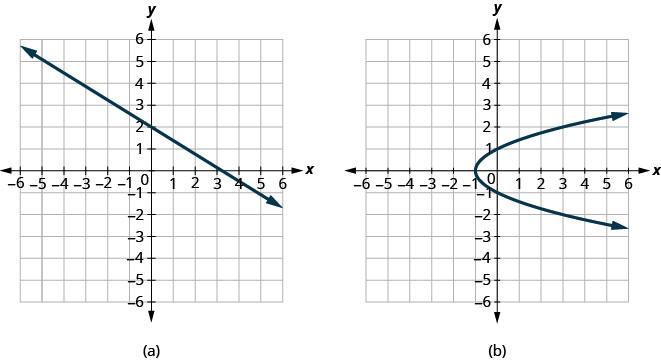
ⓐ Since any vertical line intersects the graph in at most one point, the graph is the graph of a function.
ⓑ One of the vertical lines shown on the graph, intersects it in two points. This graph does not represent a function.
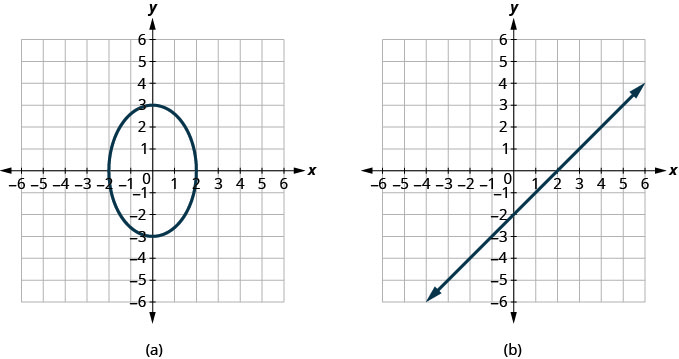
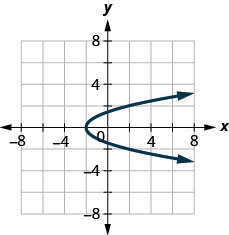
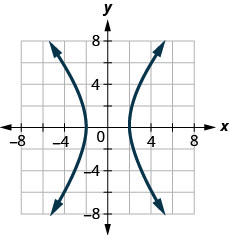
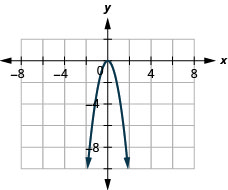
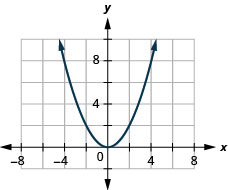
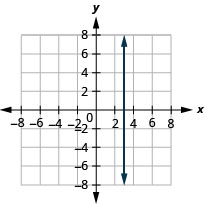
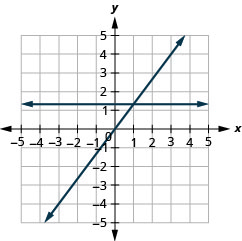
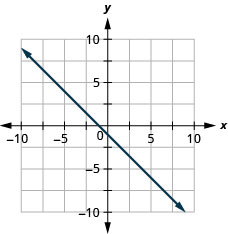
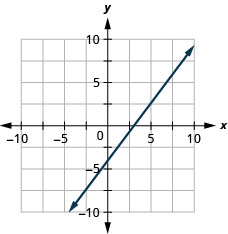
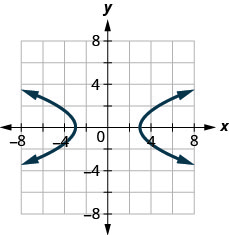
Determine whether each graph is the graph of a function.
ⓐ yes ⓑ no
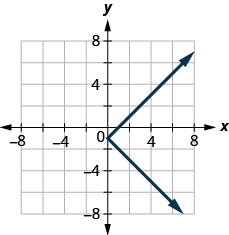
Determine whether each graph is the graph of a function.
ⓐ no ⓑ yes
Identify Graphs of Basic Functions
We used the equation and its graph as we developed the vertical line test. We said that the relation defined by the equation is a function.
We can write this as in function notation as  It still means the same thing. The graph of the function is the graph of all ordered pairs where
  So we can write the ordered pairs as
  It looks different but the graph will be the same.
Compare the graph of previously shown in (Figure) with the graph of  shown in (Figure). Nothing has changed but the notation.
The graph of a function is the graph of all its ordered pairs, or using function notation,  where
where

As we move forward in our study, it is helpful to be familiar with the graphs of several basic functions and be able to identify them.
Through our earlier work, we are familiar with the graphs of linear equations. The process we used to decide if is a function would apply to all linear equations. All non-vertical linear equations are functions. Vertical lines are not functions as the x-value has infinitely many y-values.
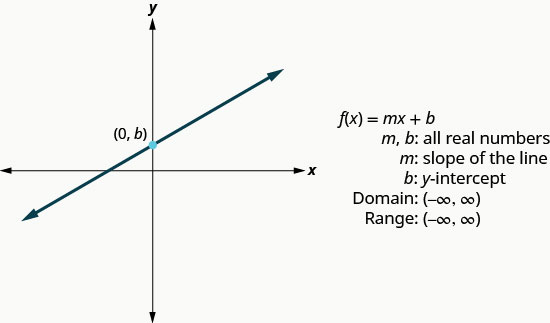
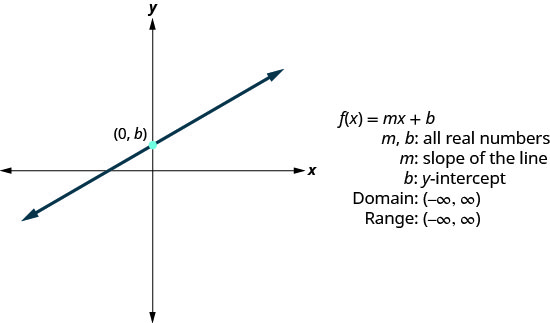
We wrote linear equations in several forms, but it will be most helpful for us here to use the slope-intercept form of the linear equation. The slope-intercept form of a linear equation is  In function notation, this linear function becomes
  where m is the slope of the line and b is the y-intercept.
The domain is the set of all real numbers, and the range is also the set of all real numbers.
We will use the graphing techniques we used earlier, to graph the basic functions.
Graph: 
 |
|
| We recognize this as a linear function. | |
| Find the slope and y-intercept. | 
|
| Graph using the slope intercept. | 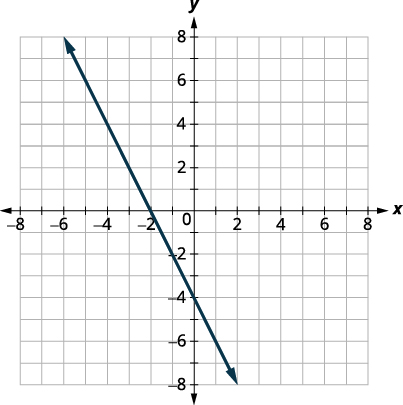 |

Graph: 
Graph: 
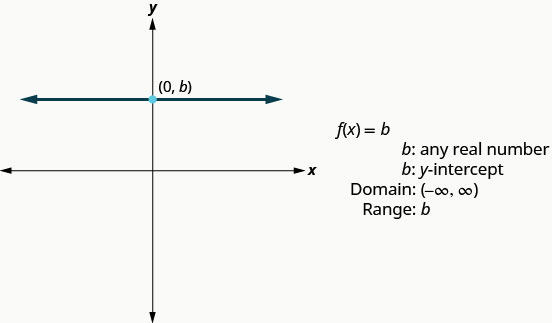
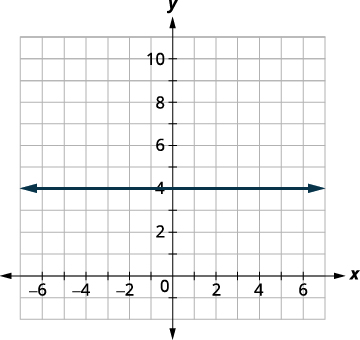
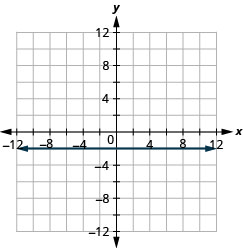
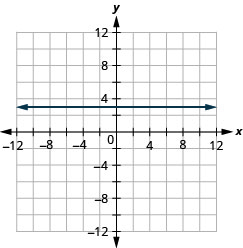
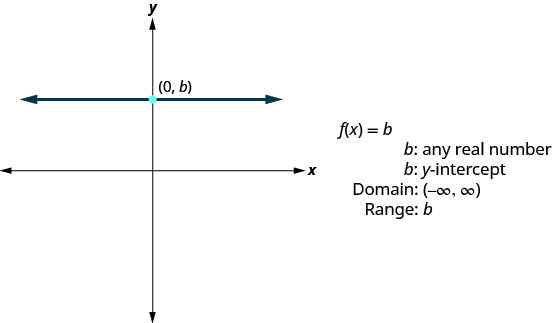
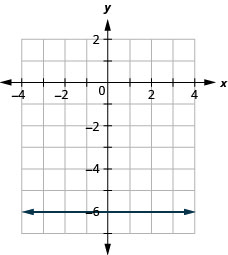
The next function whose graph we will look at is called the constant function and its equation is of the form  where b is any real number. If we replace the
  with y, we get
  We recognize this as the horizontal line whose y-intercept is b. The graph of the function is also the horizontal line whose y-intercept is b.
Notice that for any real number we put in the function, the function value will be b. This tells us the range has only one value, b.
Graph: 
 |
|
| We recognize this as a constant function. | |
The graph will be a horizontal line through  |
 |
Graph: 
Graph: 
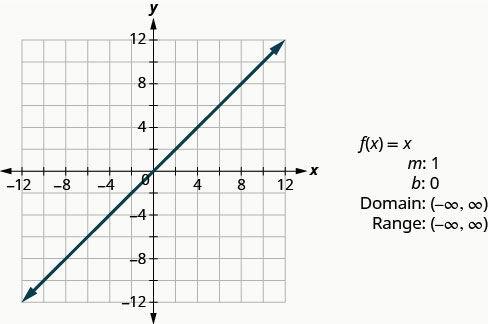
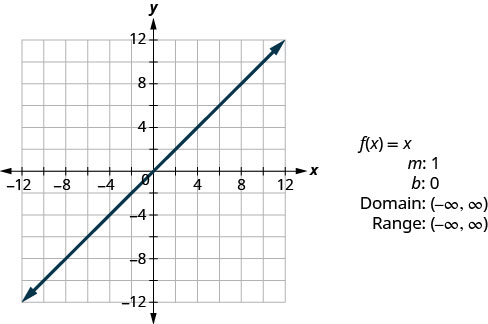
The identity function,  is a special case of the linear function. If we write it in linear function form,
  we see the slope is 1 and the y-intercept is 0.
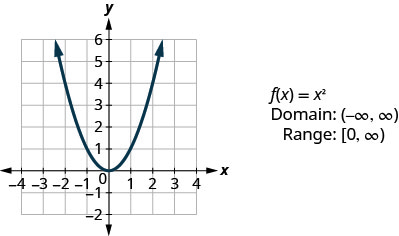
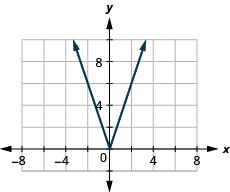
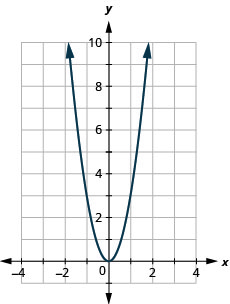
The next function we will look at is not a linear function. So the graph will not be a line. The only method we have to graph this function is point plotting. Because this is an unfamiliar function, we make sure to choose several positive and negative values as well as 0 for our x-values.
Graph: 
We choose x-values. We substitute them in and then create a chart as shown.
Graph:

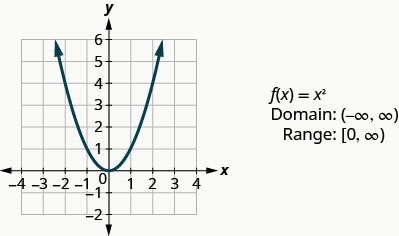
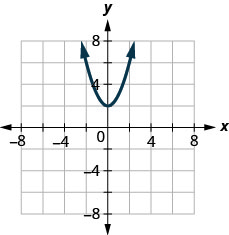
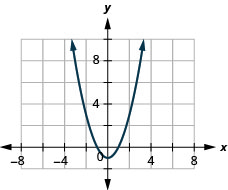
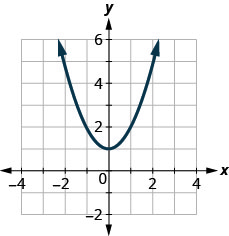
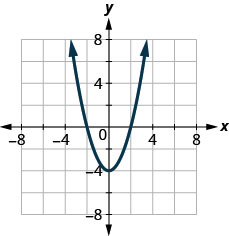
Looking at the result in (Figure), we can summarize the features of the square function. We call this graph a parabola. As we consider the domain, notice any real number can be used as an x-value. The domain is all real numbers.
The range is not all real numbers. Notice the graph consists of values of y never go below zero. This makes sense as the square of any number cannot be negative. So, the range of the square function is all non-negative real numbers.
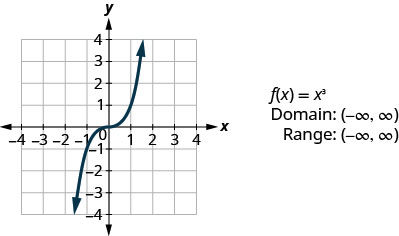
The next function we will look at is also not a linear function so the graph will not be a line. Again we will use point plotting, and make sure to choose several positive and negative values as well as 0 for our x-values.
Graph: 
We choose x-values. We substitute them in and then create a chart.
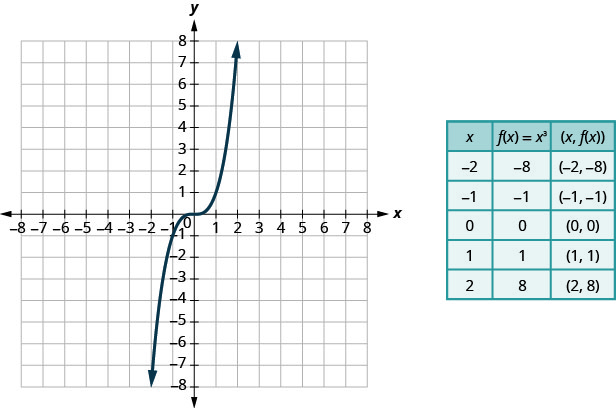
Graph:
Graph: 
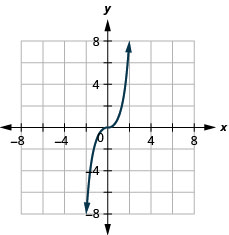
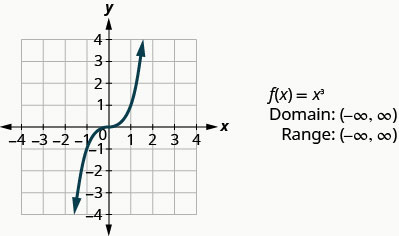
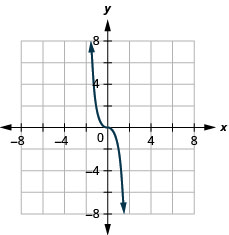
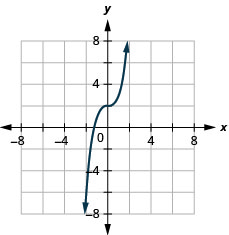
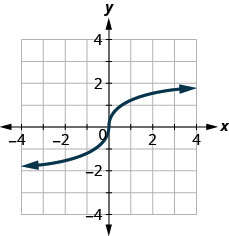
Looking at the result in (Figure), we can summarize the features of the cube function. As we consider the domain, notice any real number can be used as an x-value. The domain is all real numbers.
The range is all real numbers. This makes sense as the cube of any non-zero number can be positive or negative. So, the range of the cube function is all real numbers.
The next function we will look at does not square or cube the input values, but rather takes the square root of those values.
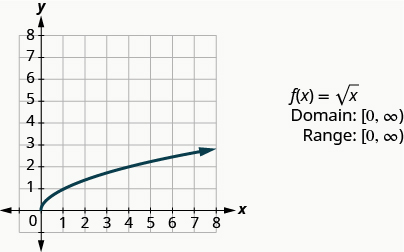
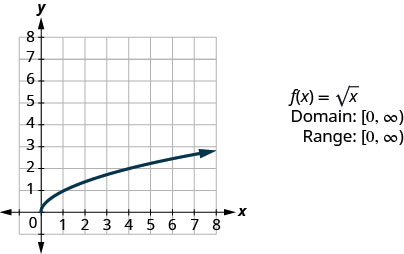
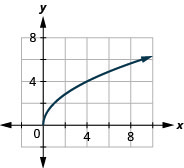
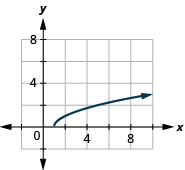
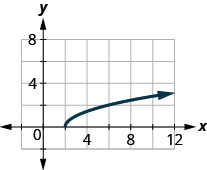
Let’s graph the function  and then summarize the features of the function. Remember, we can only take the square root of non-negative real numbers, so our domain will be the non-negative real numbers.
We choose x-values. Since we will be taking the square root, we choose numbers that are perfect squares, to make our work easier. We substitute them in and then create a chart.
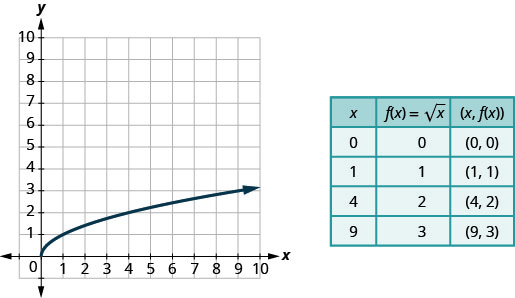
Graph: 
Graph: 
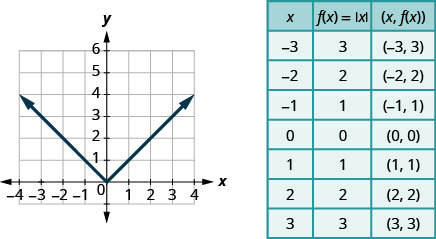
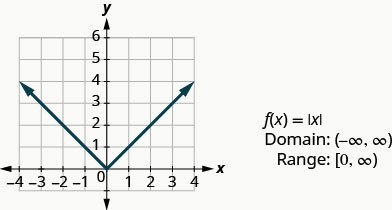
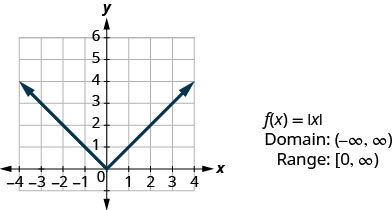
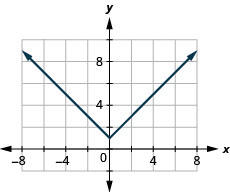
Our last basic function is the absolute value function,  Keep in mind that the absolute value of a number is its distance from zero. Since we never measure distance as a negative number, we will never get a negative number in the range.
Graph:
We choose x-values. We substitute them in and then create a chart.
Graph:
Graph: 
Read Information from a Graph of a Function
In the sciences and business, data is often collected and then graphed. The graph is analyzed, information is obtained from the graph and then often predictions are made from the data.
We will start by reading the domain and range of a function from its graph.
Remember the domain is the set of all the x-values in the ordered pairs in the function. To find the domain we look at the graph and find all the values of x that have a corresponding value on the graph. Follow the value x up or down vertically. If you hit the graph of the function then x is in the domain.
Remember the range is the set of all the y-values in the ordered pairs in the function. To find the range we look at the graph and find all the values of y that have a corresponding value on the graph. Follow the value y left or right horizontally. If you hit the graph of the function then y is in the range.
Use the graph of the function to find its domain and range. Write the domain and range in interval notation.
![This figure has a curved line segment graphed on the x y-coordinate plane. The x-axis runs from negative 4 to 4. The y-axis runs from negative 4 to 4. The curved line segment goes through the points (negative 3, negative 1), (1.5, 3), and (3, 1). The interval [negative 3, 3] is marked on the horizontal axis. The interval [negative 1, 3] is marked on the vertical axis.](https://pressbooks.bccampus.ca/jkdcbcintermediatealgebra/wp-content/uploads/sites/1018/2020/05/CNX_IntAlg_Figure_03_06_021_img_new-1-3.jpg)
To find the domain we look at the graph and find all the values of x that correspond to a point on the graph. The domain is highlighted in red on the graph. The domain is ![\left[-3,3\right].](https://pressbooks.bccampus.ca/jkdcbcintermediatealgebra/wp-content/ql-cache/quicklatex.com-bb751f5b51dd57ab8eb558729ff89520_l3.png "Rendered by QuickLaTeX.com")
To find the range we look at the graph and find all the values of y that correspond to a point on the graph. The range is highlighted in blue on the graph. The range is ![\left[-1,3\right].](https://pressbooks.bccampus.ca/jkdcbcintermediatealgebra/wp-content/ql-cache/quicklatex.com-b53d9efb8d492b05de4ca7f144d658dc_l3.png "Rendered by QuickLaTeX.com")
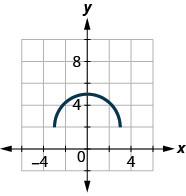
Use the graph of the function to find its domain and range. Write the domain and range in interval notation.
![This figure has a curved line segment graphed on the x y-coordinate plane. The x-axis runs from negative 6 to 6. The y-axis runs from negative 6 to 6. The curved line segment goes through the points (negative 5, negative 4), (0, negative 3), and (1, 2). The interval [negative 5, 1] is marked on the horizontal axis. The interval [negative 4, 2] is marked on the vertical axis.](https://pressbooks.bccampus.ca/jkdcbcintermediatealgebra/wp-content/uploads/sites/1018/2020/05/CNX_IntAlg_Figure_03_06_022_img_new-1-3.jpg)
The domain is ![\left[-5,1\right].](https://pressbooks.bccampus.ca/jkdcbcintermediatealgebra/wp-content/ql-cache/quicklatex.com-03b1bce6ad3600446c81dce0d81ea6c7_l3.png "Rendered by QuickLaTeX.com") The range is
The range is ![\left[-4,2\right].](https://pressbooks.bccampus.ca/jkdcbcintermediatealgebra/wp-content/ql-cache/quicklatex.com-c72bb10f618fc8de58d37425da375eed_l3.png "Rendered by QuickLaTeX.com")
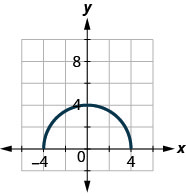
Use the graph of the function to find its domain and range. Write the domain and range in interval notation.
![This figure has a curved line segment graphed on the x y-coordinate plane. The x-axis runs from negative 4 to 5. The y-axis runs from negative 6 to 4. The curved line segment goes through the points (negative 2, 1), (0, 3), and (4, negative 5). The interval [negative 2, 4] is marked on the horizontal axis. The interval [negative 5, 3] is marked on the vertical axis.](https://pressbooks.bccampus.ca/jkdcbcintermediatealgebra/wp-content/uploads/sites/1018/2020/05/CNX_IntAlg_Figure_03_06_023_img_new-1-3.jpg)
The domain is ![\left[-2,4\right].](https://pressbooks.bccampus.ca/jkdcbcintermediatealgebra/wp-content/ql-cache/quicklatex.com-084443298b9c2ada74bb6bf3f84c2234_l3.png "Rendered by QuickLaTeX.com") The range is
The range is ![\left[-5,3\right].](https://pressbooks.bccampus.ca/jkdcbcintermediatealgebra/wp-content/ql-cache/quicklatex.com-16ae69eaa6f03e186f6669f042279286_l3.png "Rendered by QuickLaTeX.com")
We are now going to read information from the graph that you may see in future math classes.
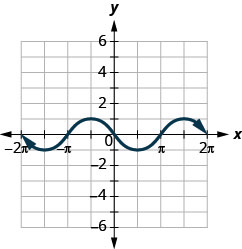
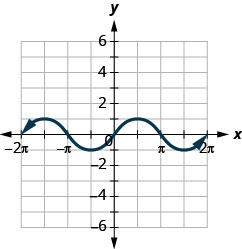
Use the graph of the function to find the indicated values.
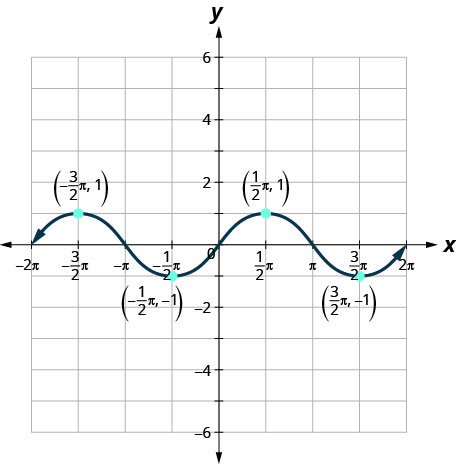
ⓐ Find: 
ⓑ Find: 
ⓒ Find: 
ⓓ Find the values for x when 
ⓔ Find the x-intercepts.
ⓕ Find the y-intercepts.
ⓖ Find the domain. Write it in interval notation.
ⓗ Find the range. Write it in interval notation.
ⓐ When  the function crosses the y-axis at 0. So,
ⓑ When  the y-value of the function is
  So,
So, 
ⓒ When  the y-value of the function is So,
ⓓ The function is 0 at the points,  The x-values when
  are
are 
ⓔ The x-intercepts occur when  So the x-intercepts occur when The x-intercepts are
ⓕ The y-intercepts occur when  So the y-intercepts occur at The y-intercept is
ⓖ This function has a value when x is from  to
to  Therefore, the domain in interval notation is
 ![\left[-2\pi ,2\pi \right].](https://pressbooks.bccampus.ca/jkdcbcintermediatealgebra/wp-content/ql-cache/quicklatex.com-5d9d2bc6f93ba4945130bb0d874e9884_l3.png "Rendered by QuickLaTeX.com")
ⓗ This function values, or y-values go from  to 1. Therefore, the range, in interval notation, is
 ![\left[-1,1\right].](https://pressbooks.bccampus.ca/jkdcbcintermediatealgebra/wp-content/ql-cache/quicklatex.com-e068b06c79619b9686e3243a8ed32b7b_l3.png "Rendered by QuickLaTeX.com")
Use the graph of the function to find the indicated values.
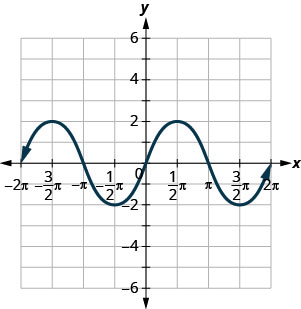
ⓐ Find:
ⓑ Find: 
ⓒ Find: 
ⓓ Find the values for x when
ⓔ Find the x-intercepts.
ⓕ Find the y-intercepts.
ⓖ Find the domain. Write it in interval notation.
ⓗ Find the range. Write it in interval notation.
ⓐ ⓑ
ⓑ ⓒ
ⓒ ⓓ for
ⓓ for  ⓔ
ⓔ  ⓕ
ⓕ  ⓖ
ⓖ ![\left[-2\pi ,2\pi \right]](https://pressbooks.bccampus.ca/jkdcbcintermediatealgebra/wp-content/ql-cache/quicklatex.com-9eca553659abf52ff7aa918edb1566c7_l3.png "Rendered by QuickLaTeX.com") ⓗ
ⓗ ![\left[-2,2\right]](https://pressbooks.bccampus.ca/jkdcbcintermediatealgebra/wp-content/ql-cache/quicklatex.com-11b3220e14bee50aca89fabdf70fc693_l3.png "Rendered by QuickLaTeX.com")
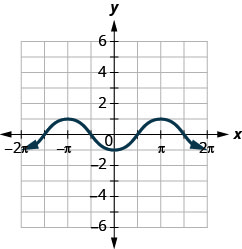
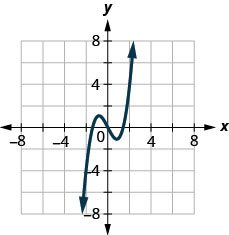
Use the graph of the function to find the indicated values.
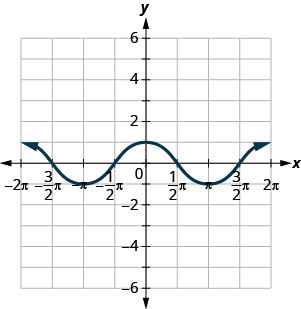
ⓐ Find:
ⓑ Find: 
ⓒ Find: 
ⓓ Find the values for x when
ⓔ Find the x-intercepts.
ⓕ Find the y-intercepts.
ⓖ Find the domain. Write it in interval notation.
ⓗ Find the range. Write it in interval notation.
ⓐ ⓑ
ⓑ ⓒ
ⓒ ⓓ for
ⓓ for  ⓔ
ⓔ  ⓕ
ⓕ  ⓖ
ⓖ ![\left[-2\text{pi},2\text{pi}\right]](https://pressbooks.bccampus.ca/jkdcbcintermediatealgebra/wp-content/ql-cache/quicklatex.com-992f7d4358b5318b11f44f8c932db1cc_l3.png "Rendered by QuickLaTeX.com") ⓗ
ⓗ ![\left[-1,1\right]](https://pressbooks.bccampus.ca/jkdcbcintermediatealgebra/wp-content/ql-cache/quicklatex.com-1948771fa2147c98ce700fec79ed4bf5_l3.png "Rendered by QuickLaTeX.com")
Access this online resource for additional instruction and practice with graphs of functions.
Key Concepts
- Vertical Line Test
- A set of points in a rectangular coordinate system is the graph of a function if every vertical line intersects the graph in at most one point.
- If any vertical line intersects the graph in more than one point, the graph does not represent a function.
- Graph of a Function
- The graph of a function is the graph of all its ordered pairs, or using function notation, where
- The graph of a function is the graph of all its ordered pairs,
- Linear Function
- Constant Function
- Identity Function
- Square Function
- Cube Function
- Square Root Function
- Absolute Value Function
Section Exercises
Practice Makes Perfect
Use the Vertical Line Test
In the following exercises, determine whether each graph is the graph of a function.
ⓐ
ⓑ
ⓐ no ⓑ yes
ⓐ
ⓑ
ⓐ
ⓑ

ⓐ no ⓑ yes
ⓐ
ⓑ
Identify Graphs of Basic Functions
In the following exercises, ⓐ graph each function ⓑ state its domain and range. Write the domain and range in interval notation.

ⓐ
ⓑ D:(-∞,∞), R:(-∞,∞)


ⓐ
ⓑ D:(-∞,∞), R:(-∞,∞)


ⓐ
ⓑ D:(-∞,∞), R:(-∞,∞)


ⓐ
ⓑ D:(-∞,∞), R:(-∞,∞)


ⓐ
ⓑ D:(-∞,∞), R:{5}


ⓐ
ⓑ D:(-∞,∞), R: 


ⓐ
ⓑ D:(-∞,∞), R:(-∞,∞)


ⓐ
ⓑ D:(-∞,∞), R:(-∞,∞)


ⓐ
ⓑ D:(-∞,∞), R:[0,∞)


ⓐ
ⓑ (-∞,∞), R:(-∞,0]


ⓐ
ⓑ (-∞,∞), R:[-∞,0)


ⓐ
ⓑ (-∞,∞), R:[ ∞)
∞)


ⓐ
ⓑ D:(-∞,∞), R:(-∞,∞)


ⓐ
ⓑ D:(-∞,∞), R:(-∞,∞)


ⓐ
ⓑ D:[0,∞), R:[0,∞)


ⓐ
ⓑ D:[1,∞), R:[0,∞)


ⓐ
ⓑ D:[ ∞), R:[−∞,∞)


ⓐ
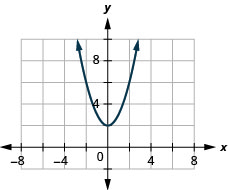
ⓑ D:(-∞,∞), R:[1,∞)

Read Information from a Graph of a Function
In the following exercises, use the graph of the function to find its domain and range. Write the domain and range in interval notation.
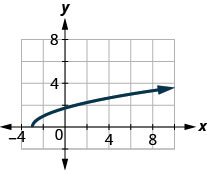
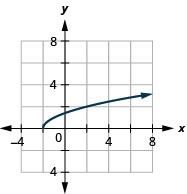
D: [2,∞), R: [0,∞)
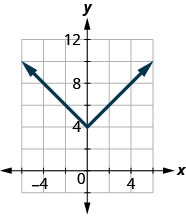
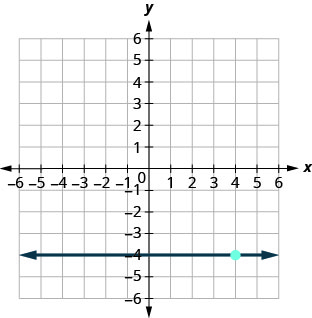
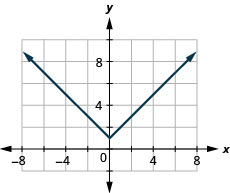
D: (-∞,∞), R: [4,∞)

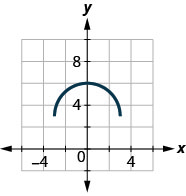
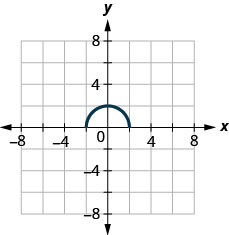
D: ![\left[-2,2\right],](https://pressbooks.bccampus.ca/jkdcbcintermediatealgebra/wp-content/ql-cache/quicklatex.com-8fd9a5f1c66188e07064702c202786cf_l3.png "Rendered by QuickLaTeX.com") R: [0, 2]
R: [0, 2]
In the following exercises, use the graph of the function to find the indicated values.
ⓐ Find:
ⓑ Find:
ⓒ Find:
ⓓ Find the values for x when
ⓔ Find the x-intercepts.
ⓕ Find the y-intercepts.
ⓖ Find the domain. Write it in interval notation.
ⓗ Find the range. Write it in interval notation.
ⓐⓑ
ⓒ ⓓ for
ⓓ for 
ⓔ 


ⓖ ⓗ
ⓐ Find:
ⓑ Find:
ⓒ Find:
ⓓ Find the values for x when
ⓔ Find the x-intercepts.
ⓕ Find the y-intercepts.
ⓖ Find the domain. Write it in interval notation.
ⓗ Find the range. Write it in interval notation
ⓐ Find:
ⓑ Find: 
ⓒ Find: 
ⓓ Find the values for x when
ⓔ Find the x-intercepts.
ⓕ Find the y-intercepts.
ⓖ Find the domain. Write it in interval notation.
ⓗ Find the range. Write it in interval notation.
ⓐ ⓑ
ⓑ ⓒ
ⓒ ⓓ for no x ⓔ none ⓕ
  ⓖ
ⓖ ![\left[-3,3\right]](https://pressbooks.bccampus.ca/jkdcbcintermediatealgebra/wp-content/ql-cache/quicklatex.com-d6177c786bcac10fac43f1de9f57af7e_l3.png "Rendered by QuickLaTeX.com")
ⓗ ![\left[-3,6\right]](https://pressbooks.bccampus.ca/jkdcbcintermediatealgebra/wp-content/ql-cache/quicklatex.com-570184b574e55d357e60c1ce72bafbfc_l3.png "Rendered by QuickLaTeX.com")
ⓐ Find:
ⓑ Find the values for x when
ⓒ Find the x-intercepts.
ⓓ Find the y-intercepts.
ⓔ Find the domain. Write it in interval notation.
ⓕ Find the range. Write it in interval notation
Writing Exercises
Explain in your own words how to find the domain from a graph.
Explain in your own words how to find the range from a graph.
Explain in your own words how to use the vertical line test.
Draw a sketch of the square and cube functions. What are the similarities and differences in the graphs?
Self Check
ⓐ After completing the exercises, use this checklist to evaluate your mastery of the objectives of this section.
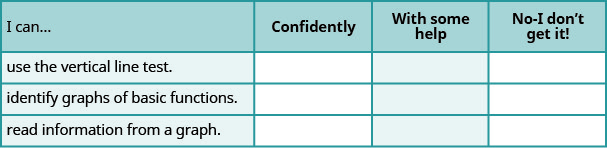
ⓑ After reviewing this checklist, what will you do to become confident for all objectives?
Chapter Review Exercises
Graph Linear Equations in Two Variables
Plot Points in a Rectangular Coordinate System
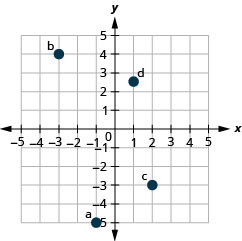
In the following exercises, plot each point in a rectangular coordinate system.
ⓐ
ⓑ
ⓒ
ⓓ
ⓐ
ⓑ
ⓒ
ⓓ
In the following exercises, determine which ordered pairs are solutions to the given equations.

ⓐ
ⓑ
ⓒ
ⓑ, ⓒ

ⓐ
ⓑ
ⓒ
Graph a Linear Equation by Plotting Points
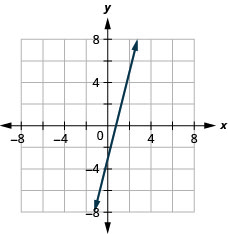
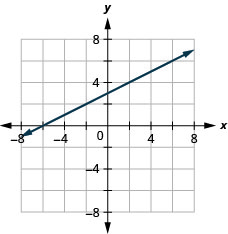
In the following exercises, graph by plotting points.


Graph Vertical and Horizontal lines
In the following exercises, graph each equation.


In the following exercises, graph each pair of equations in the same rectangular coordinate system.
 and
and
 and
and 
Find x- and y-Intercepts
In the following exercises, find the x– and y-intercepts.


In the following exercises, find the intercepts of each equation.


Graph a Line Using the Intercepts
In the following exercises, graph using the intercepts.


Slope of a Line
Find the Slope of a Line
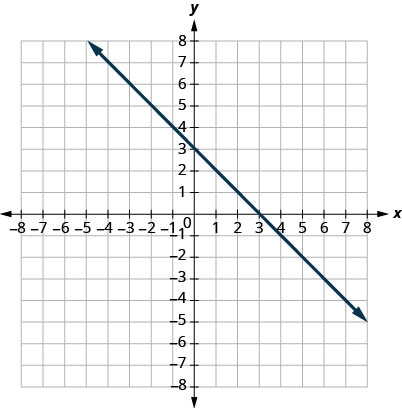
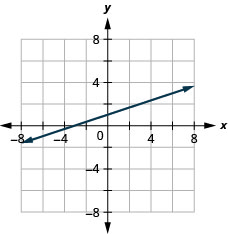
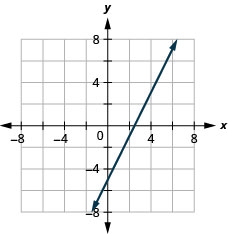
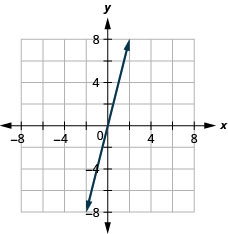
In the following exercises, find the slope of each line shown.
1

In the following exercises, find the slope of each line.


undefined


0
Use the Slope Formula to find the Slope of a Line between Two Points
In the following exercises, use the slope formula to find the slope of the line between each pair of points.


Graph a Line Given a Point and the Slope
In the following exercises, graph each line with the given point and slope.


x-intercept 

y-intercept 1; 
Graph a Line Using Its Slope and Intercept
In the following exercises, identify the slope and y-intercept of each line.


In the following exercises, graph the line of each equation using its slope and y-intercept.


In the following exercises, determine the most convenient method to graph each line.

horizontal line


intercepts


plotting points
Graph and Interpret Applications of Slope-Intercept
Katherine is a private chef. The equation  models the relation between her weekly cost, C, in dollars and the number of meals, m, that she serves.
ⓐ Find Katherine’s cost for a week when she serves no meals.
ⓑ Find the cost for a week when she serves 14 meals.
ⓒ Interpret the slope and C-intercept of the equation.
ⓓ Graph the equation.
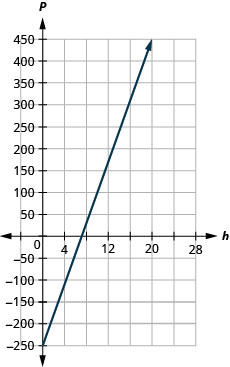
Marjorie teaches piano. The equation  models the relation between her weekly profit, P, in dollars and the number of student lessons, s, that she teaches.
ⓐ Find Marjorie’s profit for a week when she teaches no student lessons.
ⓑ Find the profit for a week when she teaches 20 student lessons.
ⓒ Interpret the slope and P-intercept of the equation.
ⓓ Graph the equation.
ⓐ
ⓑ ?450
ⓒ The slope, 35, means that Marjorie’s weekly profit, P, increases by ?35 for each additional student lesson she teaches.
The P-intercept means that when the number of lessons is 0, Marjorie loses ?250.
ⓓ
Use Slopes to Identify Parallel and Perpendicular Lines
In the following exercises, use slopes and y-intercepts to determine if the lines are parallel, perpendicular, or neither.


neither


not parallel
Find the Equation of a Line
Find an Equation of the Line Given the Slope and y-Intercept
In the following exercises, find the equation of a line with given slope and y-intercept. Write the equation in slope–intercept form.
slope  and
and  -intercept
slope  and -intercept

slope 0 and -intercept 
slope  and -intercept
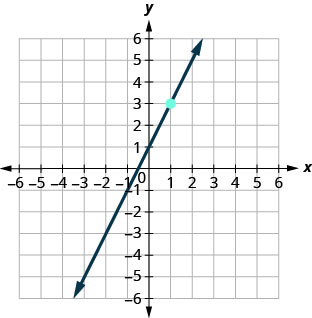
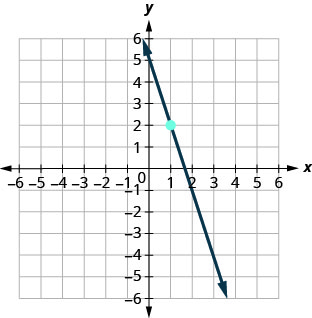
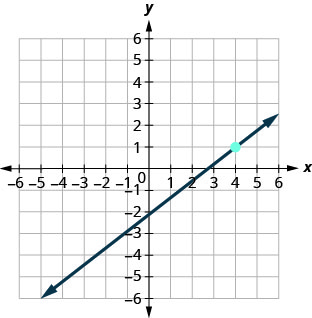
In the following exercises, find the equation of the line shown in each graph. Write the equation in slope–intercept form.


Find an Equation of the Line Given the Slope and a Point
In the following exercises, find the equation of a line with given slope and containing the given point. Write the equation in slope–intercept form.
 point
point 
 point
point 

Horizontal line containing 
 point
point 

Find an Equation of the Line Given Two Points
In the following exercises, find the equation of a line containing the given points. Write the equation in slope–intercept form.
 and
and 
 and
and 

 and
and 
 and
and 
Find an Equation of a Line Parallel to a Given Line
In the following exercises, find an equation of a line parallel to the given line and contains the given point. Write the equation in slope–intercept form.
line  point
point 
line  point
point 

line  point
point 
line  point
point 

Find an Equation of a Line Perpendicular to a Given Line
In the following exercises, find an equation of a line perpendicular to the given line and contains the given point. Write the equation in slope–intercept form.
line  point
point 
line  point
point 

line  point
point
line  point
point 

Graph Linear Inequalities in Two Variables
Verify Solutions to an Inequality in Two Variables
In the following exercises, determine whether each ordered pair is a solution to the given inequality.
Determine whether each ordered pair is a solution to the inequality 
ⓐⓑ ⓒⓓ
ⓒⓓ
ⓔ
Determine whether each ordered pair is a solution to the inequality 
ⓐ ⓑ
ⓑ ⓒ
ⓒ ⓓ
ⓓ ⓔ
ⓔ
ⓐ yes ⓑ no ⓒ yes ⓓ yes; ⓔ no
Recognize the Relation Between the Solutions of an Inequality and its Graph
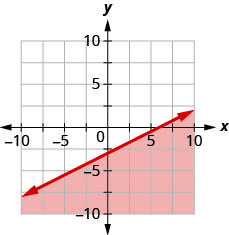
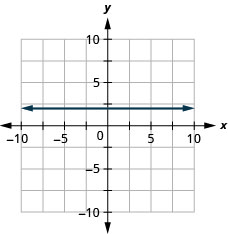
In the following exercises, write the inequality shown by the shaded region.
Write the inequality shown by the graph with the boundary line 
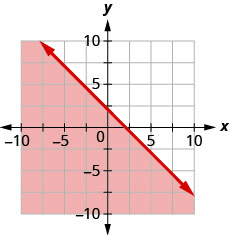
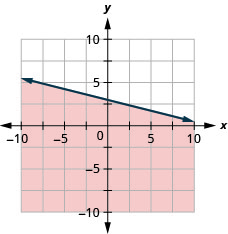
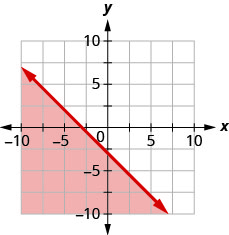
Write the inequality shown by the graph with the boundary line 
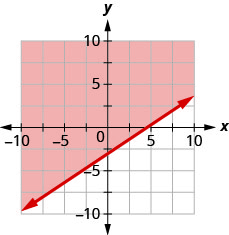

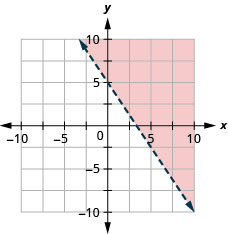
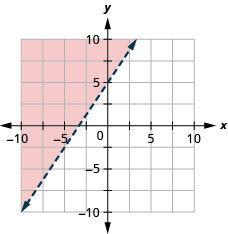
Write the inequality shown by the shaded region in the graph with the boundary line 
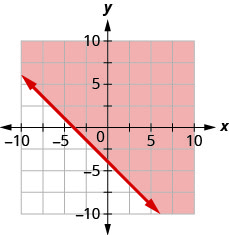
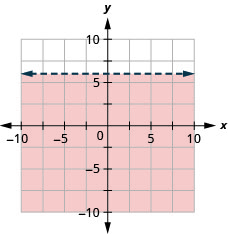
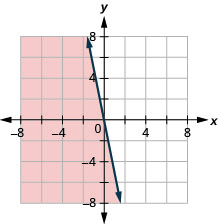
Write the inequality shown by the shaded region in the graph with the boundary line 

Graph Linear Inequalities in Two Variables
In the following exercises, graph each linear inequality.
Graph the linear inequality 
Graph the linear inequality 
Graph the linear inequality 
Graph the linear inequality 
Graph the linear inequality 
Graph the linear inequality 
Solve Applications using Linear Inequalities in Two Variables
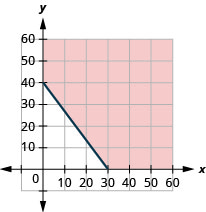
Shanthie needs to earn at least ?500 a week during her summer break to pay for college. She works two jobs. One as a swimming instructor that pays ?10 an hour and the other as an intern in a law office for ?25 hour. How many hours does Shanthie need to work at each job to earn at least ?500 per week?
ⓐ Let x be the number of hours she works teaching swimming and let y be the number of hours she works as an intern. Write an inequality that would model this situation.
ⓑ Graph the inequality.
ⓒ Find three ordered pairs that would be solutions to the inequality. Then, explain what that means for Shanthie.
Atsushi he needs to exercise enough to burn 600 calories each day. He prefers to either run or bike and burns 20 calories per minute while running and 15 calories a minute while biking.
ⓐ If x is the number of minutes that Atsushi runs and y is the number minutes he bikes, find the inequality that models the situation.
ⓑ Graph the inequality.
ⓒ List three solutions to the inequality. What options do the solutions provide Atsushi?
ⓐ
ⓑ
ⓒ Answers will vary.
Relations and Functions
Find the Domain and Range of a Relation
In the following exercises, for each relation, ⓐ find the domain of the relation ⓑ find the range of the relation.


ⓐ D: {−3, −2, −1, 0}
ⓑ R: {7, 3, 9, −3, 8}
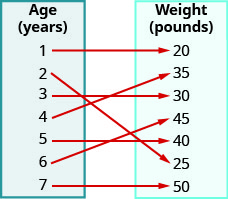
In the following exercise, use the mapping of the relation to ⓐ list the ordered pairs of the relation ⓑ find the domain of the relation ⓒ find the range of the relation.
The mapping below shows the average weight of a child according to age.
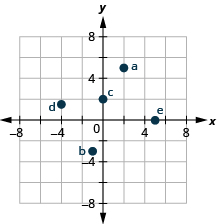
In the following exercise, use the graph of the relation to ⓐ list the ordered pairs of the relation ⓑ find the domain of the relation ⓒ find the range of the relation.
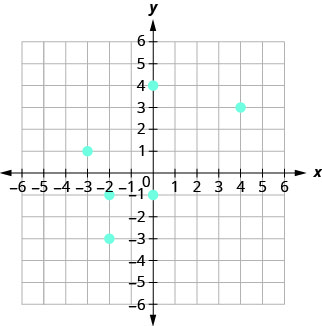
ⓐ (4, 3), (−2, −3), (−2, −1), (−3, 1), (0, −1), (0, 4),
ⓑ D: {−3, −2, 0, 4}
ⓒ R: {−3, −1, 1, 3, 4}
Determine if a Relation is a Function
In the following exercises, use the set of ordered pairs to ⓐ determine whether the relation is a function ⓑ find the domain of the relation ⓒ find the range of the relation.


ⓐ yes ⓑ {−3, −2, −1, 0, 1, 2, 3}
ⓒ {0, 1, 8, 27}
In the following exercises, use the mapping to ⓐ determine whether the relation is a function ⓑ find the domain of the function ⓒ find the range of the function.
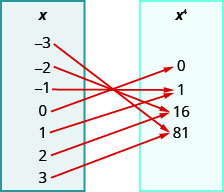
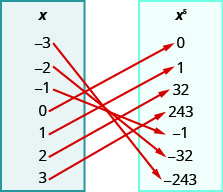
ⓐ {−3, −2, −1, 0, 1, 2, 3}
ⓑ {−3, −2, −1, 0, 1, 2, 3}
ⓒ {−243, −32, −1, 0, 1, 32, 243}
In the following exercises, determine whether each equation is a function.


yes


yes

Find the Value of a Function
In the following exercises, evaluate the function:
ⓐ ⓑ
ⓑ ⓒ
ⓒ

ⓐ ⓑ
ⓑ ⓒ
ⓒ


ⓐ ⓑ
ⓑ ⓒ
ⓒ

In the following exercises, evaluate the function.


2


18

Graphs of Functions
Use the Vertical line Test
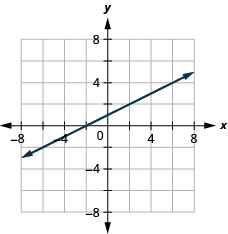
In the following exercises, determine whether each graph is the graph of a function.
yes
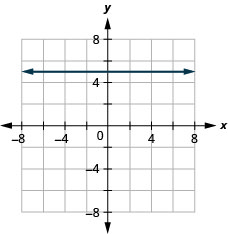
no
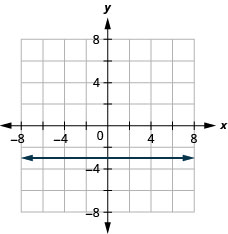
yes
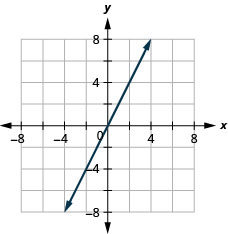
no
Identify Graphs of Basic Functions
In the following exercises, ⓐ graph each function ⓑ state its domain and range. Write the domain and range in interval notation.


ⓐ
ⓑ D: (-∞,∞), R: (-∞,∞)


ⓐ
ⓑ D: (-∞,∞), R: (-∞,∞)
ⓐ
ⓑ D: (-∞,∞), R: (-∞,0]


ⓐ
ⓑ D: (-∞,∞), R: (-∞,∞)

ⓐ
ⓑ D: [ ∞), R: [0,∞)

ⓐ
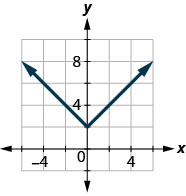
ⓑ D: (-∞,∞), R: [1,∞)
Read Information from a Graph of a Function
In the following exercises, use the graph of the function to find its domain and range. Write the domain and range in interval notation
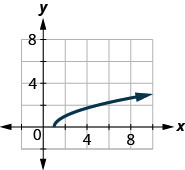
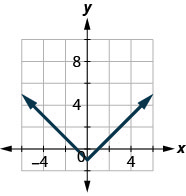
D: (-∞,∞), R: [2,∞)
In the following exercises, use the graph of the function to find the indicated values.
ⓐ Find
ⓑ Find
ⓒ Find
ⓓ Find the values for x when
ⓔ Find the  -intercepts.
ⓕ Find the -intercepts.
ⓖ Find the domain. Write it in interval notation.
ⓗ Find the range. Write it in interval notation.
ⓐⓑ
ⓒ ⓓ for
ⓓ for
ⓔ 


ⓖ ⓗ
ⓐ Find
ⓑ Find the values for x when
ⓒ Find the -intercepts.
ⓓ Find the -intercepts.
ⓔ Find the domain. Write it in interval notation.
ⓕ Find the range. Write it in interval notation.
Practice Test
Plot each point in a rectangular coordinate system.
ⓐ
ⓑ
ⓒ
ⓓ
ⓔ
Which of the given ordered pairs are solutions to the equation 
ⓐ ⓑⓒ
ⓑⓒ
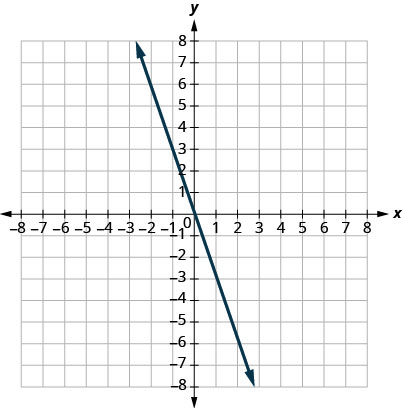
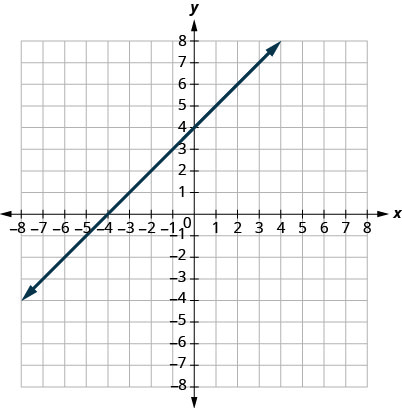
Find the slope of each line shown.
ⓐ
ⓑ
ⓐ ⓑ undefined
Find the slope of the line between the points and 
Graph the line with slope  containing the point
Find the intercepts of  and graph.
Graph the line for each of the following equations.


Find the equation of each line. Write the equation in slope-intercept form.
slope  and -intercept
 point
point 

containing  and
and 
perpendicular to the line  containing the point

Write the inequality shown by the graph with the boundary line 
Graph each linear inequality.


Hiro works two part time jobs in order to earn enough money to meet her obligations of at least ?450 a week. Her job at the mall pays ?10 an hour and her administrative assistant job on campus pays ?15 an hour. How many hours does Hiro need to work at each job to earn at least ?450?
ⓐ Let x be the number of hours she works at the mall and let y be the number of hours she works as administrative assistant. Write an inequality that would model this situation.
ⓑ Graph the inequality .
ⓒ Find three ordered pairs that would be solutions to the inequality. Then explain what that means for Hiro.
Use the set of ordered pairs to ⓐ determine whether the relation is a function, ⓑ find the domain of the relation, and ⓒ find the range of the relation.


ⓐ yes ⓑ  ⓒ {0, 1, 8, 27}
Evaluate the function: ⓐ  ⓑ
ⓑ  ⓒ
ⓒ 

For  evaluate
12
Determine whether the graph is the graph of a function. Explain your answer.
In the following exercises, ⓐ graph each function ⓑ state its domain and range.
Write the domain and range in interval notation.
ⓐ
ⓑ D: (-∞,∞), R: [1,∞)
ⓑ Find the -intercepts.
ⓒ Find 
ⓓ Find 
ⓔ Find the domain. Write it in interval notation.
ⓕ Find the range. Write it in interval notation.
ⓐ ⓑ
ⓑ
ⓒ ⓓ
ⓓ
ⓔ D: (-∞,∞) ⓕ R: [ ∞)
∞)
