Topic C: Picture Graphs
Picture graphs are similar to bar graphs. Picture graphs are used to compare quantities. A little picture represents a certain amount. Look for the legend to find out that amount. Picture graphs will give fractions of a picture also. For example, if the picture represents 100 things, half a picture would be 50.
Graph 1
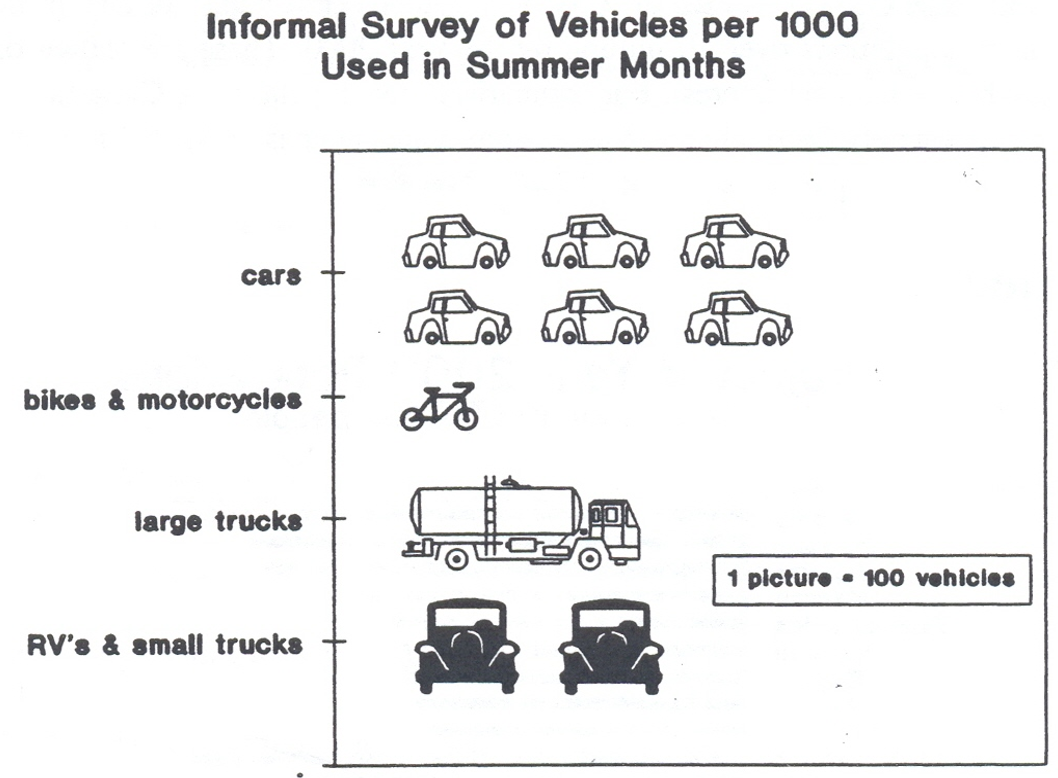
- At first glance, which type of vehicle is most in use?
- What does each picture represent according to the legend?
- Out of every 1,000 vehicles, how many are:
- cars?
- bikes and motorcycles?
- large trucks?
- RVs and small trucks?
- Look for other examples of picture graphs in newspapers and magazines. Television programs often display picture graphs to illustrate statistics.
Answers for Graph 1
- Car
- 100 vehicles
-
- 600
- 100
- 100
- 200
