2
Environmental Geology is divided into 5 units and each unit is based on some of the chapters in the open textbook “Environmental Geology”. For those of you taking the course for credit, each unit also has an associated assignment. You can start working on the assignment as you are going through each unit, the textbook readings, exercises and chapter-end questions, or you can wait until you are finished the readings and other activities.
Topics of Unit 1
- Earth Systems science.
- Natural controls over the climate, and past changes in Earth’s climate.
- Glaciations and their erosional and depositional impacts on our environment.
Learning Activities
- Read Course Unit 1 (this document) and complete embedded activities.
- Read Chapters 1, 3, and 4 in the Environmental Geology textbook (https://environmental-geology-dev.pressbooks.tru.ca/) and complete embedded exercises.
Note: Chapter 2 of the textbook includes a review of some relevant aspects of geology. If you haven’t recently completed an introductory course in Physical Geology (which might also have been called something like “Introduction to Earth Science”) you should probably read that chapter as well. - Answer chapter-end questions for textbook Chapters 1, 3 and 4.
Learning Assessment
Complete Assignment 1 (link) and submit that for marking to your instructor. The assignment is worth 12% of your final mark.
Intended Learning Outcomes
- Describe aspects of the Earth system.
- Explain the mechanisms for the natural controls over the Earth’s climate.
- Discuss glacial processes in general, the erosional effects of alpine glaciation, and the deposits of glaciation.
A note on figure and table numbering: These course units include references to figures and tables in the textbook, and also to figures and tables in this document. The textbook references are always of the form “Figure 1.2.1” where the first number refers to the chapter in the textbook, the second to the section of that chapter, and the third to the figure number in that section. The Course Units references are of the form Figure 1-1, where the first number is the unit number, and the second is the figure number in that unit. Sections, figures and tables in the textbook all have “dot” separators. Sections, figures and tables in this document all have “dash” separators.
1-1 Earth Systems Science and Environmental Geology
The key thing to understand about the Earth as a system is that while there is effectively no exchange of matter with other celestial bodies, there is an extraordinary amount of exchange of matter and energy within the various systems of the Earth (e.g., between the atmosphere and oceans). Much of that exchange is driven by the energy we receive from the sun, but energy from within the Earth is also an important driving force, especially over geological time.
Some of the more obvious interactions that take place all around us are summarized on Figure 1.2.1 in the textbook. Almost all of these interactions involve water in some way. That might be the flow of water as rain or streams or underground, but it also includes the massive amount of water moved through the atmosphere in the form of water vapour, as well as the transfer of substances suspended or dissolved in water. Movement of water in the form of ice is also important.
As shown on Figure 1.2.2, by far the greatest volume of water flow on Earth is via evaporation from the oceans and rain back down into the oceans. The annual volume of river flow into the oceans is less than 10% of the amount rain that falls on the oceans, and the flow of groundwater to the oceans is less still. It is also important to note that the volume of water transferred from land to the atmosphere—by evaporation and by transpiration from plants—is greater than the volume that flows into the oceans and rivers. Most of that transfer (about 90%) is by direct evaporation (from the ground and from lakes and rivers), and the rest is by transpiration from plants.
Although there are many ways that water moves, it also remains within some reservoirs for very long periods. This is illustrated on Figure 1.2.3. Water is held within plants, the atmosphere and in rivers for only weeks, on average, but in glaciers (because they remain frozen) and the oceans (because they are vast) for thousands of years. Groundwater deep within the crust moves extremely slowly and can remain there for millions of years. Not shown on Figure 1.2.3 is the water contained within minerals in rocks, some of which can remain locked up for hundreds of millions, or even billions, of years.
The key roles of the sun in various Earth Systems processes are illustrated on Figure 1.2.5. Solar energy drives water movement through evaporation and ocean currents (and wind currents as described in Box 1-1), but it also powers the growth of plants, heats the surfaces of the Earth directly—and then the atmosphere indirectly—and contributes to geological processes like weathering.
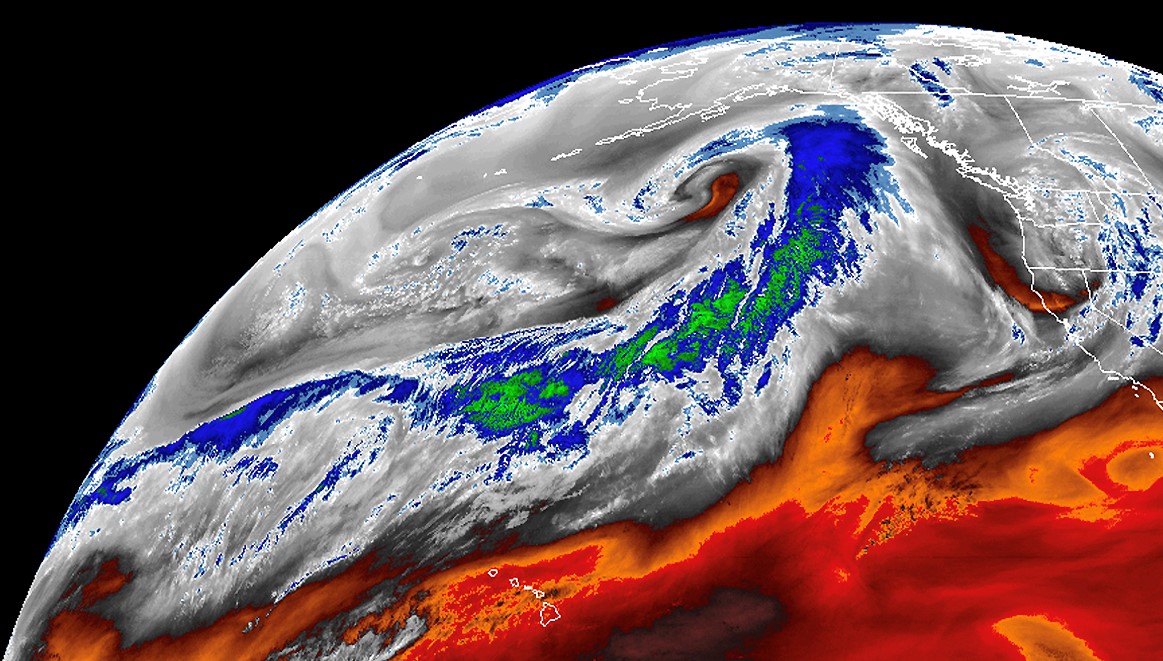
Box 1-1 What is an Atmospheric River?
In November of 2021 the residents of southern British Columbia and northern Washington became very familiar with the term “atmospheric river”, as wave after wave of moisture-laden air flowed in from the Pacific, bringing devastating floods, slope failures and other disasters to the region (more on that later in this course). Figure 1-1 shows the moisture and cloud pattern from a similar but less powerful atmospheric river in January 2020. The intensity of the blue and green colours is proportional to the amount of moisture being transported (as water vapour and water droplets). According to NOAA, a strong atmospheric river can transport water at a rate between 7 and 15 times the flow of the Mississippi River.
An atmospheric river is a graphic illustration of the Earth system in action, as it represents the transportation of water onto land. That same water then flows off the land bringing massive amounts of sediments and dissolved constituents into the ocean. The river flows of November 2021 in southern British Columbia would also have transported parts of peoples homes and other belongings, plus ripped up vegetation and the carcasses of thousands of farm animals, out into the ocean.
The construction of mountains is critically important to Earth Systems because it enhances the rate of erosion and weathering. Weathering plays a role in controlling the climate by consuming carbon dioxide from the atmosphere and transferring it to the ocean and eventually into ocean sediments. While the sun is, by far, the major driver of Earth systems, the Earth’s internal energy also plays an important role. Some of the critical internally-driven processes are illustrated on Figure 1.2.6. They include mantle convection, which drives plate tectonics, and therefore contributes to plate collisions and mountain building, volcanism (which contributes water and important gases to the atmosphere) and subduction (which moves geological and other materials from the surface back into the mantle).
Figure 1.2.6 doesn’t show the Earth’s core, where the convective motion of liquid iron generates the Earth’s magnetic field. The magnetic field is critical to life on Earth as it deflects the charged particles of the solar wind (that would have stripped away our atmosphere by now without a magnetic field) and protects us from harmful cosmic radiation.
As noted in the Declaration on Earth System Science (Box 1.3 in the textbook) and illustrated on Figure 1.2.7, the Earth System can be changed significantly by human activities, and there is no shortage of evidence that this is happening now. The current most serious consequence of human activities is that we are changing the climate, but other consequences include destruction and poisoning of ecosystems on both land and in the oceans, destabilization of slopes, and disruptions to surface water systems. These other consequences are all made worse by climate change.
Section 1.3 of the textbook provides a brief overview of the topics that are covered in Environmental Geology. Please review that carefully, as it will give you an idea of where we are going in this course, and how many of the different topics that we’ll be covering relate to one-another.
1-2 Geological Controls over the Earth’s Climate
As noted in section 3.1 of the textbook, understanding past changes in Earth’s climate is key to understanding anthropogenic (human-caused) climate change, and so we are going to review some of those changes in this section of the course. They have taken place, and continue to take place, on many different time scales, from billions of years to just minutes. Some of them are highly relevant to the processes of anthropogenic climate change; others are not. The geological controls over the Earth’s climate, and the history of our changing climate, are covered in Chapter 3 of the textbook. Please read that chapter, either before or while you are going through the material that follows here. If you aren’t familiar with the basic processes of climate change—such as how the greenhouse effect actually works, why albedo is important to climate, or the significance of climate feedbacks—you might want to read through Climate Change (Chapter 19) from the open textbook Physical Geology (https://opentextbc.ca/physicalgeology2ed/).
Past climate changes have been recorded in the geological record, in ancient rocks like those shown on Figure 3.0.1, or in relatively recent sediments on the sea-floor, or in glacial ice, or in the growth rings of trees, or the shells of living marine organisms. Earth scientists—with their experience in reading these types of records, their understanding of the geological processes that led to some of the important changes, and their appreciation for the vastness of geological time—are uniquely qualified to understand the history of Earth’s climate.
Solar and Atmospheric Evolution
As described in section 3.1 of the textbook, our sun, like all similar stars, is very slowly getting hotter, and sending more energy to the Earth (Figures 3.1.1 and 3.1.2). Over billions of years this increase in energy arriving on Earth would have led to a steady increase in the temperature on the Earth’s surface. However, that effect has been offset by the evolution of life, and the ability of life processes to change the composition of the atmosphere and hence the climate. Most of that change has been accomplished by taking carbon dioxide out of the atmosphere and storing it in the rocks of the Earth’s crust, so reducing the greenhouse effect. This process, and the biological changes that contributed to it, are illustrated on Figure 3.1.3. Note the (mostly) consistent slow decrease in the CO2 level over geological time, and relatively rapid rise of methane when life first evolved, and then the rapid decline of methane when the oxygen level started to increase.
There are two different types of processes that change our climate, forcings and feedbacks. The forcings are changes like the increase in greenhouse gas levels that is happening at present, while feedbacks are consequent changes that either strengthen the forcing (positive feedbacks) or suppress it (negative feedbacks). Box 3.2 in the textbook provides a summary of the important feedbacks that have played a role in past climate changes and are still operating today. Please take a close look at Table 3.1.1 and ensure that you understand how those feedbacks work.
Plate Tectonics and Climate
The various climate effects of plate tectonics are summarized in section 3.2 of the textbook. One of these is how the continents are situated on the globe because that can affect albedo and so lead to cooling.
Why was that effect greater during the Proterozoic than it would be today?
A second effect is the construction of mountain chains, for the reasons already noted above, and a third is how plate tectonics can affect ocean currents. While we can predict with some confidence that a continental collision that produces a chain of mountains will lead to enhanced weathering and therefore consumption of atmospheric CO2 (and therefore to cooling), it is very difficult to predict how a future change in ocean currents resulting from a tectonic process might affect the climate, either on a local or a global scale. There are many ways in which ocean currents could be changed by tectonics in the future, and predicting how such changes might affect the climate is not straightforward.
The combined effects of mountain building and changes to ocean currents during the Cenozoic era are summarized on Figure 3.2.4. These processes have had a long-term cooling effect that has taken us from the hot-house of the Eocene era (ca. 55 Ma) to the ice-house of the Pleistocene era.
Volcanism and Climate
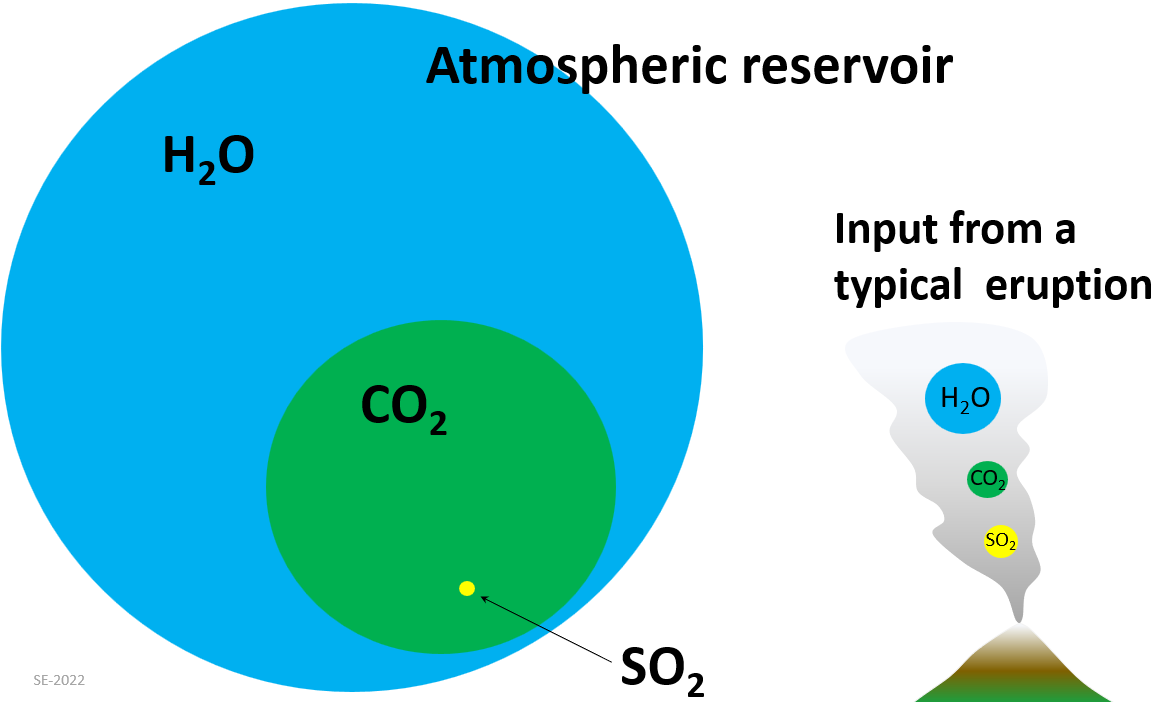
Volcanism can significantly affect the climate on both short and long time scales because volcanic eruptions add gases to the atmosphere. It is important to understand the message of Table 3.3.1 and the surrounding content because that will help you understand the role of volcanism in climate change.
As is shown here on Figure 1-2, while a large volume of water is released during a volcanic eruption, it is a tiny amount compared with the amount of water already in the atmosphere. Furthermore, most of that volcanic water remains in the atmosphere for only days. Volcanic water has no effect on our climate.
A lot of CO2 is also released during an eruption, and while that is also small relative to the amount already in the atmosphere, CO2 can remain in the atmosphere for thousands of years, and so a long period of greater than average volcanism can result in a gradual but significant increase in the CO2 level, and eventually to warming.
In contrast, a single volcanic eruption can produce many times more SO2 than is typically stored in the atmosphere. That will have an immediate cooling effect because the SO2 gets converted to sulphate aerosols that block incoming sunlight. The effect will normally be short-lived because sulphate aerosols only stay in the atmosphere for a year or two.
The measured cooling effects of volcanic sulphate aerosols from three explosive eruptions in the 20th century are shown on Figure 3.3.1 in the textbook, and the modeled effects of CO2 warming and sulphate cooling for the massive Siberian Traps eruptions at around 250 Ma are shown on Figure 3.3.2.
Orbital Variations and Climate
The Earth’s orbital and tilt variations are quite complex, and while you don’t need to understand them in detail, it is important to be aware of the following features:
- Our orbit around the sun is an ellipse (not a perfect circle) and the shape of that ellipse changes with time (Figure 3.4.1). When the orbit is most circular there is less potential for winter-summer extremes.
- The Earth is tilted relative to the plane of its orbit (Figure 3.4.2), and that tilt (which is what gives us our seasons) varies. The less tilt the less extreme the seasons.
- The direction of the tilt varies (the spinning Earth wobbles like a top) and the tilt direction determines which hemisphere (north or south) is farthest from the sun in summer.
The combination of these variations results in differences in the amount of solar heating at various latitudes on the Earth, and as described in the textbook, cool summers at high latitudes in the northern hemisphere promote the growth of glacial ice. This is especially so as the relatively cool summers would go on for thousands of years.
Ocean Currents and Climate
During the nearly 2.6 million years of the Pleistocene era, the Earth experienced a series of cold glacial periods and less-cold interglacial periods (like the one we’re in now). As shown on Figure 3.4.3, there is strong evidence that these variations were modulated by the orbital cycles, but it’s important to remember that these cycles did not cause the climate cooling that led to the glaciations of the late Cenozoic era. That can be attributed to the factors summarized on Figure 3.2.4. Orbital cycles have existed throughout the Earth’s history, and there is evidence that they have also influenced other aspects of the climate (e.g., monsoon variations).
Ocean currents represent the most significant transportation of mass and thermal energy anywhere on Earth. The surface currents (Figure 3.5.1 in the textbook) are mostly driven by the winds (and so are powered by the sun), but the deeper currents (Figure 3.5.2) are powered by differences in water density, and so gravity is a driving force. Illustrated in Figure 3.5.5, seawater density differences are related to the salinity of the water (saltier water is denser than fresher water) and to the temperature of the water. Figure 1-3 shows the result of an experiment conducted with coloured water of different densities. You can easily do something like this at home with a teaspoon of salt, some hot and cold water, and a few drops of food colouring.
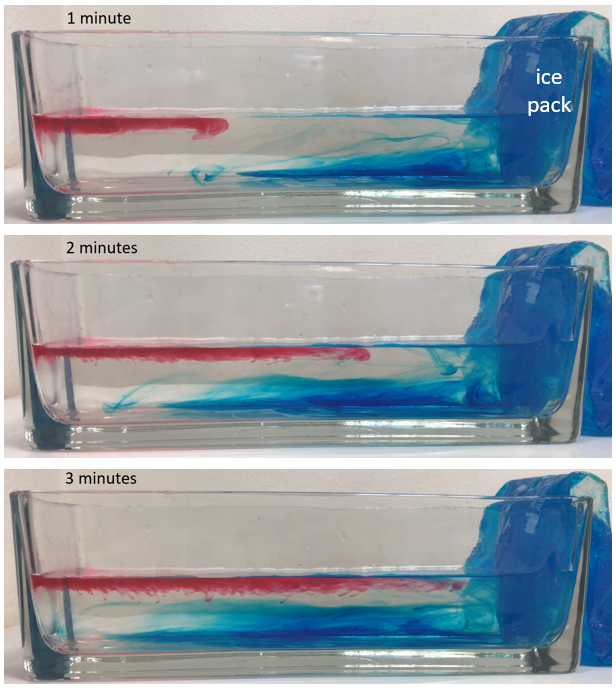
Exercise 1-1 Water Density Experiment
You can do something similar (but a little different) to what is shown on Figure 1-3 as follows:
- Fill a glass container with a volume of about 500 mL (a dish like the one in Figure 1-3, a drinking glass or glass jar) nearly to the top with room-temperature water. Add about 1/2 teaspoon of salt and stir well.
- In another small jar or glass, mix about 1 teaspoon of salt into about 50 mL of cold water from the tap (or from the refrigerator if your tap water isn’t cold). Add a couple of drops of blue food colouring. Stir well to dissolve the salt, but don’t worry if some of it won’t dissolve.
- Place about 50 mL of hot water (hot from the tap is sufficient) in another small jar or glass and add a couple of drops of red food colouring and stir.
- Gently pour about 20 mL of the blue salty water down the side of the larger jar. It should sink to the bottom and stay there.
- Lower a tablespoon of the hot red water into the water in the top part of the jar. It should stay near to the top, and the thermal and salinity stratification that you’ve created should last for some time, until the 3 types of water start to mix.
The salinity oscillator described on Figure 3.5.4 and the surrounding content is based on the principles demonstrated on Figure 1-3 (although no salt was used in that demonstration) and in the experiment above (Exercise 1-1). Salty water from the tropical part of the Atlantic sinks readily when it cools down in the far northern Atlantic, but if that water has been diluted by fresh water from melting glacial ice, the tendency to sink is reduced. The ~1500 year oscillation cycle is a function of how long it takes for glacial ice to build up during the cold parts of the cycle, and how long it takes before enough of that ice melts to dilute the Gulf Stream during the warm part.
Exercise 1-2 Visualizing Continental Positions
The following is an interactive version of Exercise 3.3 in the Environmental Geology textbook (https://environmental-geology-dev.pressbooks.tru.ca/).
The density of ocean water is a function of its temperature and salinity, and the relationship is shown on the figure below, where density (red lines) is expressed in g/L. For example, at a salinity of 2.5% and a temperature of 10⁰ C, the density is 1027 g/L. The table has a list of salinities and typical water temperatures for some offshore locations, some within the Gulf Stream in the Atlantic and two within the Pacific. Point to those locations on the graph, and enter the density value provided in the table that follows.
| Location | Salinity (%) | T (° C) |
| North Carolina | 3.64 | 20 |
| Newfoundland | 3.58 | 15 |
| Iceland | 3.52 | 9 |
| Svalbard | 3.45 | 2 |
| Baja Sur | 3.4 | 20 |
| Los Angeles | 3.35 | 13 |
[h5p id=”2″] [h5p id=”3″]
Extraterrestrial Impacts and Climate
Large extraterrestrial impacts are exceedingly rare on Earth, and, as far as we know, there has only ever been one—the K-Pg event— that caused intense climate effects and devastation to life. The important climate-change take-aways from section 3.6 of the textbook are that a large impact sends a vast amount of dust and gases into the atmosphere, and that can lead to immediate climate-cooling. Cooling also resulted from the smoke from intense, nearly global wildfires that followed the K-Pg impact. Also of note is that, depending on what type of rock is impacted (such as limestone in the case of the K-Pg impact), the cooling could be followed by greenhouse warming (CO2 from the CaCO3 of the limestone), which in this case is modelled to have lasted about 100,000 years.
1-3 Glaciation
As described in section 4.1 of your textbook, There have been many glaciations during Earth’s history (Figure 4.1.1), and some of the processes that have led to those are significant changes in the composition of the atmosphere (caused by biological processes or enhanced rock weathering), changes in the positions of the continents (that have led to albedo differences or changes in ocean currents), or some combinations of these. The factors that led up to the current glacial cycle are summarized on Figure 3.2.4, and the changes over the last 5 million years of that process are illustrated on Figure 4.1.5.
Exercise 1-3 Pleistocene Glacials and Interglacials
The following is an interactive version of Exercise 4.1 in the Environmental Geology textbook (https://environmental-geology-dev.pressbooks.tru.ca/).
The figure below shows the past 500,000 y of global temperatures from the same data set shown in Figure 4.1.5 in the textbook. The last five glacial periods are marked with snowflakes. The most recent one, which peaked at around 20 ka, is known as the Wisconsin Glaciation.
The current interglacial (Holocene) is marked with a red circle. Identify the five previous interglacial periods.
[h5p id=”4″]
The focus of this part of the course is on the erosional effects and the depositional products of glaciers in general, but especially those of the Pleistocene glaciations.
Section 4.2 provides a summary of the main different types of glaciers (continental versus alpine glaciers). Although there are currently only continental glaciers on Antarctica and Greenland (Figure 4.2.2 and 4.2.3), huge ice sheets covered much of North America (Figure 4.1.7) and a good part of Europe during the height of the Wisconsin Glaciation.
The mechanics of glacial ice movement are explained on Figure 4.2.7, and it is important to understand what is going on there. Although the diagram depicts an alpine glacier, the principles also apply to a continental glacier. The key point of 4.2.7 is that while ice is normally brittle, it will become plastic—and therefore can deform and flow—when it is under pressure because of the thickness of the ice above it and because of the slope of the surface of the ice. The cutoff for deformation is about 100 kPa, which is defined by the red dashed line. Below that the ice will deform (flow), and the deformation of each “piece” will be passed on the ice immediately above it (which is also deforming) and so the rate of flow increases upward to the red line. Above the red line the ice only moves along with the ice beneath it.
Another important factor is whether or not the base of the ice is warm enough for liquid water to be present. If it is warm, and the ice-rock interface is wet, the glacier can also slide along its base (in addition to moving by flow, as described above). If it is cold, the glacier will be frozen to its base, and it can only move by internal flow (Figure 4.2.9). A sliding glacier moves faster in most cases, and tends to erode its base much more effectively than one that is stuck to the rock.
Completing Exercise 4.2 in the textbook should help you understand how glaciers move and the role of melting ice at the front of a glacier.
Glacial Erosion
Glaciers move due to the force of gravity, and so they move from mountains down into valleys, or, in the case of continental glaciers, from areas where the ice is thickest to where it is thinner. Glacial erosion takes place because of the forward movement of the ice and of the water derived from the glacier. While glaciers cannot move up-slope, nor backward, the front end of a glacier can advance, or stay in the same place, or retreat. That is because there is a balance between the rate of forward motion and the rate of retreat due to melting at the front. Almost all glaciers in the world are retreating at present because of anthropogenic climate change, but the ice of those glaciers is still moving forward, and still eroding the base as a result of that forward motion. Completing Exercise 4.2 should help you understand these processes.
Glacial erosion is covered in section 4.3 of the textbook, and as described at the start of that section, while ice alone doesn’t have much erosive power, ice with embedded sedimentary grains is very effective at eroding rocks.
In areas of continental glaciation—like most of Canada and some of the northern US—glacial erosion has left relatively flat terrain, but in mountainous regions glacial erosion has contributed to the formation of very steep terrain, with sharp peaks and ridges and with wide steep-sided (U-shaped) valleys. These types of features are illustrated on Figures 4.3.2 through 4.3.9 in the textbook. In general, glaciated mountains have much steeper slopes that non-glaciated mountains, and as we’ll see in Unit 2, that has implications for slope stability.
Glacial Deposits
If you live in almost any part of Canada or the northern part of the US, you are likely surrounded by glacial sediments, although they are not easy to see. They make up lodgement- or ablation-till blankets that cover millions of square km. They are present in end-moraines that extend for hundreds of km, and exist as large sand and gravel deposits from glacial meltwater rivers, or silt and clay deposits that were deposited on the beds of glacial lakes.
The depositional settings for some of these types of deposits are illustrated on Figures 4.4.1 and 4.4.2 in the textbook, and examples of what they look like are provided on Figures 4.4.3 through 4.4.9. Glacial sediments are important to environmental geology for many reasons, including the following:
- They include material with a range of grain sizes that can be used for construction of anything from buildings, to dams, to roads, and many of the glacial deposits of these materials are situated in places that can make their exploitation less environmentally damaging than gravel deposits associated with existing rivers.
- Many (but not all) glacial deposits are sufficiently porous and permeable to be useful aquifers for drinking and industrial water supplies.
- Unconsolidated glacial sediments are commonly present on the steep slopes created by alpine glaciers, and this can worsen an already serious slope stability situation.
Glaciers and Climate Change
Glaciers are obviously sensitive to climate warming. Not only are they receding quickly in all parts of the Earth (as exemplified by Figure 4.5.1 in the textbook), but that melting has many other effects on the environment as summarized in the list following Figure 4.5.2.
| Process | Positive feedback? | Feedback mechanism |
| Shrinking glaciers expose bare rock | Yes | Bare rock absorbs more solar energy and so leads to more heating and more melting. |
| Sea level rise | ||
| Dilution of ocean water because of glacial melting | ||
| Melting permafrost | ||
| Proglacial lakes get larger | ||
| Slopes no longer supported by ice | ||
| Reduction in human water supply | ||
| Reduction in ecosystem water | ||
| Reduced appeal for tourism |
Media Attributions
- Figure 1-1 An atmospheric river flowing across the northern Pacific Ocean by US National Atmospheric and Oceanographic Administration, public domain image
- Figure 1-2 Atmospheric reservoir (diagram) by Steven Earle, CC BY 4.0
- Figure 1-3 Oceanic overturning circulation images are by Mirjam Glessmer and are licensed CC BY NC SA 4.0
References
Earle, S. (2019). Physical Geology (2nd ed.). Victoria, B.C.: BCcampus. https://opentextbc.ca/physicalgeology
Glessmer, M. (2020, December 2). 24 Days of #KitchenOceanography — Oceanic overturning circulation [digital image]. Adventures in Oceanography and Teaching. https://mirjamglessmer.com/tag/overturning/
US National Environmental Satellite, Data, and Information Service (NESDIS). (2020, January 28). An atmospheric river flowing across the northern Pacific Ocean [digital image], GOES West Views Atmospheric River in the Pacific Ocean. US National Oceanic and Atmospheric Administration (NOAA). https://www.nesdis.noaa.gov/news/goes-west-views-atmospheric-river-the-pacific-ocean
PRESSBOOK LINK: