Confidence Intervals
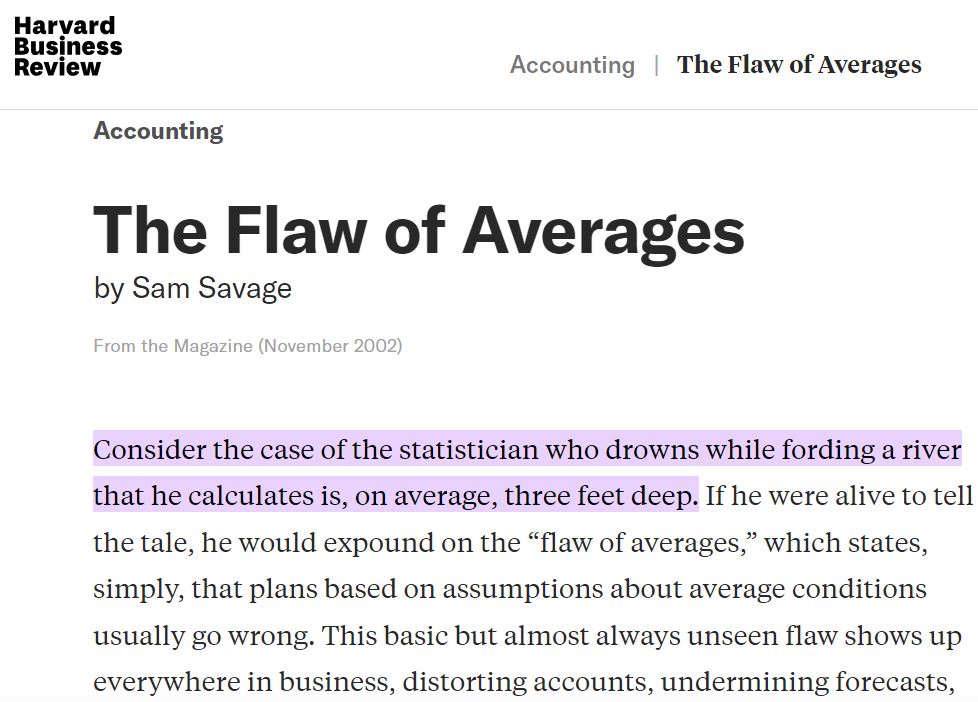
The Flaw of Averages
Learning Objectives
In this section, look at an applied example where more than averages are needed to describe the data and speak of the flaw of averages concept.
In the previous section, we were attempting to forecast monthly demand for an emergency medical device that varies over time.
In this case, we have very little control over the variation in monthly demand and there is no ‘quality control’ measures that can be performed to reduce this variation. The only way we could have reduced the variation in the sample averages was to take a very large sample size (~24,000 pens)! The key in an example like this is to realize several things:
- Averages and standard deviations only make up part of the description of this type of data set
- Analyzing the fluctuations that occur over time can be very informative also
- Capturing/recording what can be controlled in these types of examples can be helpful.
Possible Controls for Demand Example
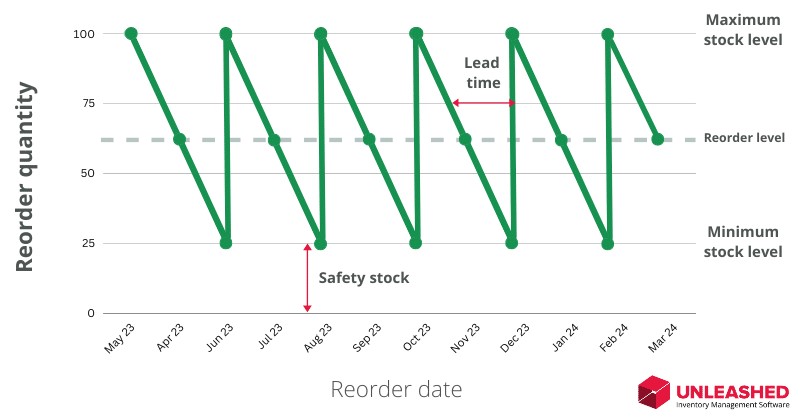
The “controls” that are possible for the demand problem is in choosing the supplier, level of inventory to hold (re-order point and safety stock) and order quantities to choose.
Using an average to inform decisions on these values falls short. This makes up part of the ‘flaw of averages’ concept.
The Flaw of Averages
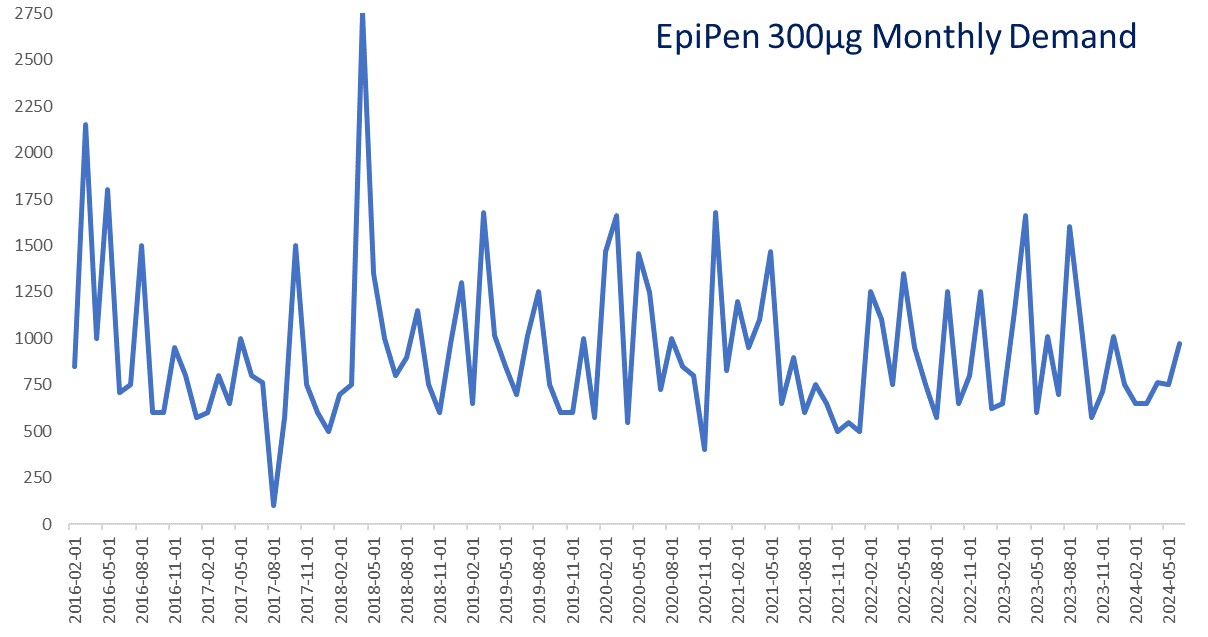
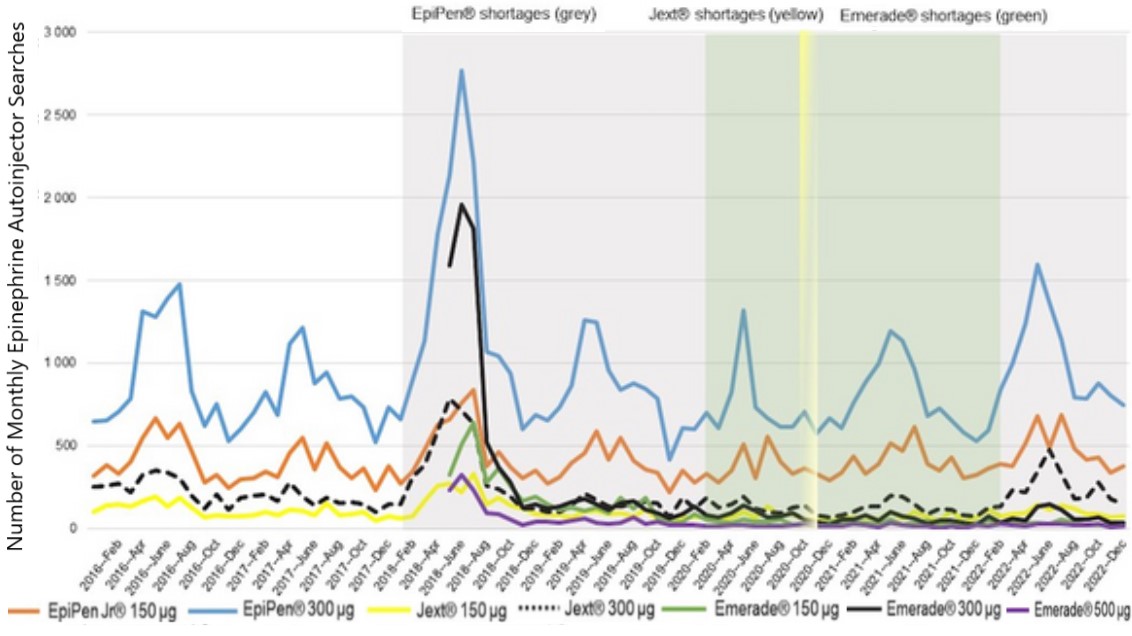
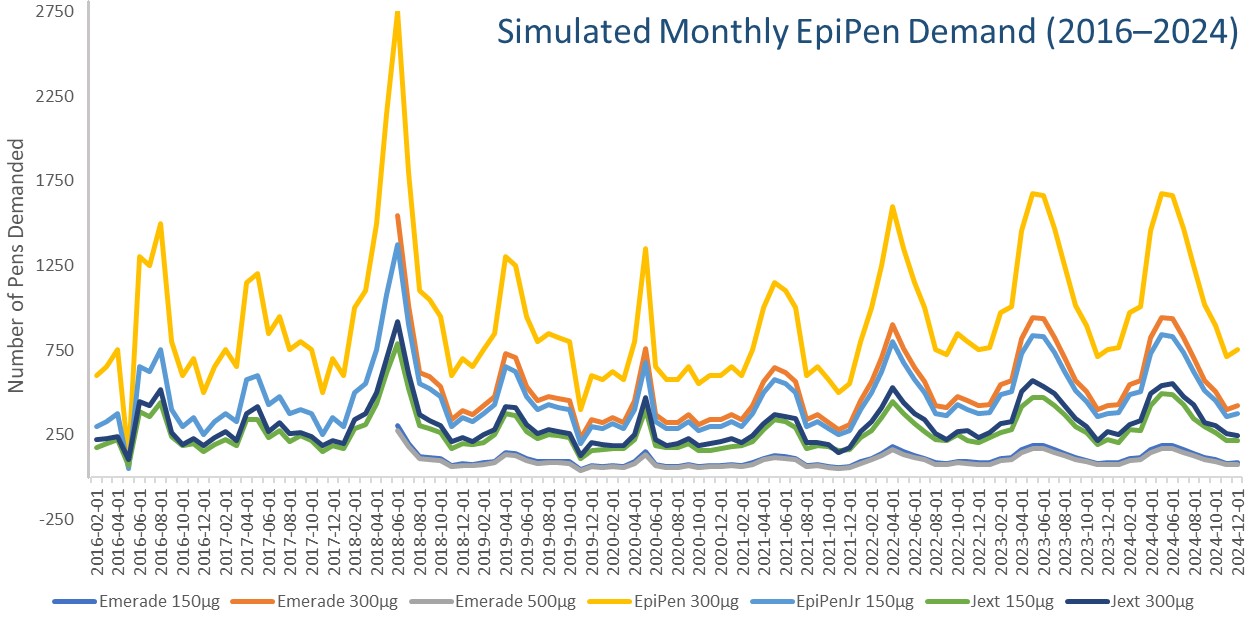
See the images for the number of EpiPens demanded given in our example and the actual graph from a report outlining the crisis when there was a shortage of EpiPens worldwide. We can appreciate that fitting an average to these curves will miss the mark for almost all values on the charts below.
 |
 |
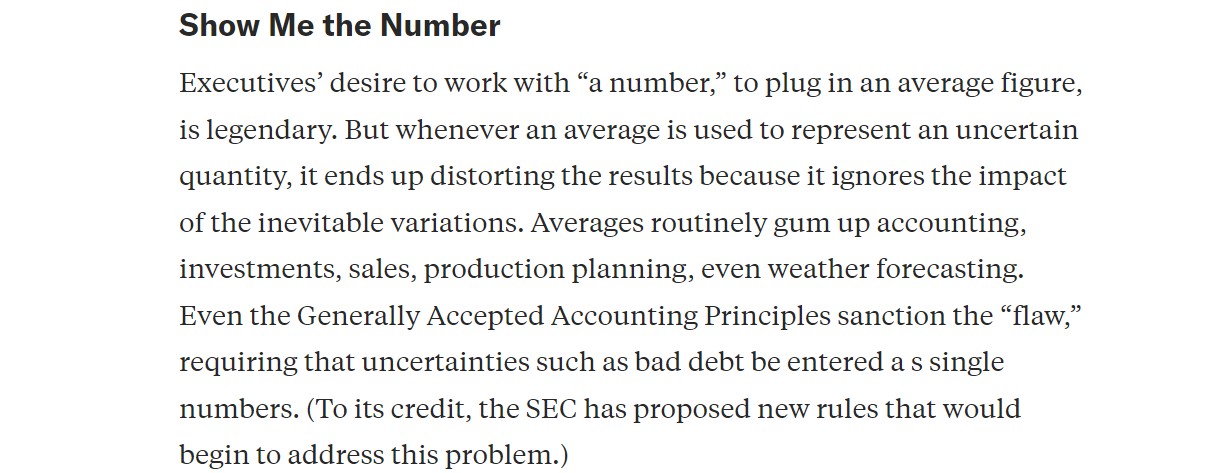
There is a pain-point when it comes to emergency medicine shortages as well as medicines with short shelf-lives. In the latter case, it can be very difficult to order an appropriate amount of stock month-over-month and very costly when the incorrect levels are ordered. This is what Sam Savage speaks to in his Flaw of Averages article in Harvard Business Review and several of his books.
 |
 |
In short, some problems, where reduced variance is ideal, are well suited to using confidence intervals for analysis. Whereas, some examples, where is an uncontrollable level of variance that occurs over time must have other metrics and analysis performed in addition to the sample statistics and interval estimates. We will visit a space fastener example in a future section that is well described by its sample statistics.
Further Analysis Demand Data (VIDEO)
As we saw in the previous section, if we want to reduce the margin of error to five pens for the we need to sample over 24,000 demands. Why is this so large and what should be considered and changed in our approach? We will explore these issues in the next example.
Example 49.1
Problem Setup: Your boss is unhappy with the overwhelming sample size required that you just came up with (in Example 48.1.2 in the previous section) and wants you to explore other ways to estimate the true monthly demand.
Questions: Several questions when attempting to discover reasons why the confidence interval is so wide and/or the required sample size is so large when attempting to reduce the margin of error:
- Is the sample of 101 months of demand a proper sample?
- What type of data is this demand data?
- How might we visually ‘inspect’ the data?
- How are ‘off’ is the average from the actual data month-over-month?
- How might we better generate a confidence interval for future months’ demands?
Solutions: Click here to download the Excel file shown in the video below:
Click here to reveal the written solutions shown in the video above
- The sample of 101 demands is not a proper sample. We can consider the fact that perhaps we should segregate different months differently. We have only sampled from one store/warehouse and not many. Also, this data changes over time. There are many considerations that should be taken into account when examining/sampling time series data.
- This demand data is time series data where one entry has been recorded per month over several years.
- In order to visually ‘inspect’ the data, we could create a Line Chart in Excel of the data. Note: we must be sure that the dates we have in the left-most column are properly formatted as dates in Excel.
- The margin of error we calculate of 77 is a good reflection of the average deviation between the average and the actual number of units demanded. Some months have larger deviations that others also. A good question to ask of time series data is whether is seasonality in the data or dependence on previous timesteps.
- We could try using Excel’s Forecast Sheet in the Data Tab to build up a different type of 95% confidence interval. Forecast sheets using a type of ETS (Exponential Smoothing Method) to generate its forecasts. These and ARIMA models are highly used to handle time series data.
