Confidence Intervals
Applied Example where σ is Unknown
Learning Objectives
In this section, we will do the following calculations to estimate the true mean when the population standard deviation (σ) is unknown:
- Review an applied example where confidence intervals are well suited
- Compare to the previous example where confidence intervals were not well suited
- Calculate the lower and upper limits of the confidence interval
- Calculate the required sample size given a required maximum margin of error
In the previous section, we purposefully used an example that did poorly at predicting future demand. In contrast, in this section, we will choose an example that is well suited to using confidence intervals to analyze the quality control on the product(s) produced.
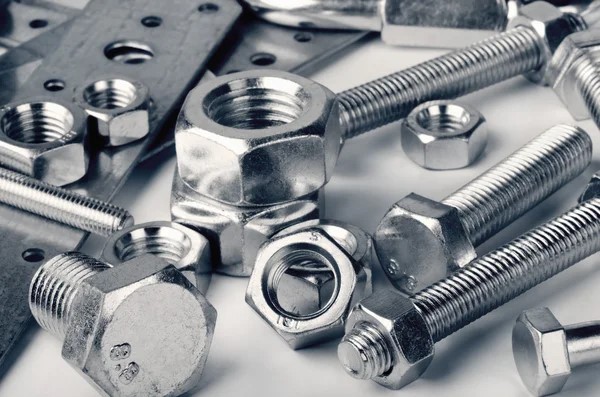
Quality Control on Space Fasteners
We will look at quality control for space fasteners that could be supplied to organizations and companies like NASA, SpaceX and other companies that build satellites and other machines used in space. These companies must have very strict quality control and adherence to requirements policies.
 |
 |
Space fasteners, which would be machine-produced should be fairly uniform and doing analysis based off of their sample statistics such as mean and standard deviation is very appropriate. The parts should have little variation in dimensions and standard deviations would be a great measure to determine the level of variation in the the parts' dimensions, materials' performance and so on.
Constructing a Confidence Interval using T.INV.2T (VIDEO)
We will produce confidence intervals for several types of space fasteners in the examples below. In this first example, we will use Excel's T.INV.2T() function.
Example 51.1
Problem Setup: A company supplies Standard Hexagon Head Cap Screws. They perform regular quality control checks by sampling some of the screws produced and measuring and testing the screws:
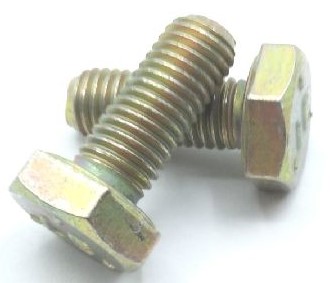
- They sample 100 screws.
- The mean length of the screws sampled is 0.6245 inches.
- The standard deviation of the lengths is 0.0124 inches.
Question: Construct the 99% confidence interval for the screw lengths. What are the highest and lowest average screw lengths with 99% certainty?
Solution: Click here to download the Excel file shown in the video below.
Conclusion: There is a 99% chance that the average bolt length is between 0.6212 and 0.6277 inches in length.
Click here to reveal the written solutions from the above video
Solving for the T-Score
Let us first write out the values needed for T.INV.2T:
- [latex]n = 100[/latex]
- [latex]df = n - 1 = 100 - 1 = 99[/latex]
- [latex]\alpha = 1-0.99 = 0.01[/latex]
This gives: [latex]t = \text{T.INV.2T}(\alpha, df) = \text{T.INV.2T}(0.01, 99) = 2.6264[/latex]
Building up the Confidence Interval
To build the confidence interval, we use the [latex]t[/latex]-score above and the following values:
- [latex]\bar{x} = 0.6245[/latex]
- [latex]s = 0.0124[/latex]
This gives:
- [latex]CL_{Lower} = \bar{x}-t \cdot \frac{s}{\sqrt{n}} = 0.6245 - 2.6264 \cdot \frac{0.0124}{\sqrt{100}} = 0.6245 - 0.0033 = 0.6212[/latex]
- [latex]CL_{Upper} = \bar{x}+t \cdot \frac{s}{\sqrt{n}} = 0.6245 + 2.6264 \cdot \frac{0.0124}{\sqrt{100}} = 0.6245 + 0.0033 = 0.6277[/latex]
Conclusion
There is a 99% chance that the average screw length is between 0.6212 and 0.6277 inches in length.
Constructing a Confidence Interval using T.INV (Video)
Let us next look at an example where quality control is performed on shear bolts. In this example, we will use Excel's T.INV() to calculate the [latex]t[/latex]-score.
Example 51.2
Problem Setup: An large order of shear bolts has been received at a spacecraft manufacturing company.
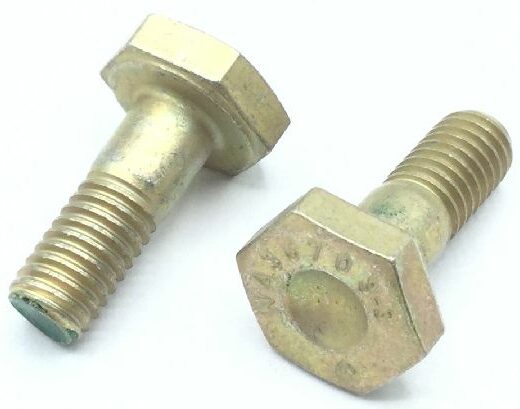
They perform quality control on the order received before paying the manufacturer for the order. They find the following sample statistics based off of the 400 shear bolts they sampled:
- The average bolt length is 0.6251 inches
- The standard deviation of the bolt lengths is 0.0019 inches.
The quality control team constructs the 90% confidence interval for the bolt lengths based off of the sample statistics they found.
Question: What confidence interval limits would the team have calculated?
Solution: Click here to download the Excel file shown in the video below.
Conclusion: The true average length of the hexaton head cap screws is between 0.6212 and 0.6277 inches with 99% certainty.
Click here to reveal the solutions shown in the video above.
Solving for the T-Score
Let us first write out the values needed for T.INV:
- [latex]n = 400[/latex]
- [latex]df = n - 1 = 400 - 1 = 399[/latex]
- [latex]\alpha = 1-0.90 = 0.10[/latex]
- [latex]\frac{\alpha}{2} = \frac{0.10}{2} = 0.05[/latex]
This gives: [latex]t = \text{T.INV}(\frac{\alpha}{2}, df) = \text{T.INV}(0.05, 399) = 1.6487[/latex]
Building up the Confidence Interval
To build the confidence interval, we use the [latex]t[/latex]-score above and the following values:
- [latex]\bar{x} = 0.6251[/latex]
- [latex]s = 0.0019[/latex]
This gives:
- [latex]CL_{Lower} = \bar{x}-t \cdot \frac{s}{\sqrt{n}} = 0.6251 - 1.6487 \cdot \frac{0.0019}{\sqrt{400}} = 0.6251 - 0.00015 = 0.62495[/latex]
- [latex]CL_{Upper} = \bar{x}+t \cdot \frac{s}{\sqrt{n}} = 0.6251 + 1.6487 \cdot \frac{0.0019}{\sqrt{400}} = 0.6251 + 0.00015 = 0.62525[/latex]
Conclusion
There is a 90% chance that the average bolt length is between 0.62495 and 0.62525 inches in length.
Constructing a Confidence Interval using CONFIDENCE.T (Video)
Let us revisit the previous example but now use Excel's CONFIDENCE.T() function to solve for the margin of error all in one step (instead of solving for the [latex]t[/latex]-score and then calculating the margin of error).
Example 51.3
Problem Setup: Again, we are doing quality control on our large sample of shear bolts. The following is true:
- [latex]\bar{x} = 0.6251[/latex]
- [latex]s = 0.00119[/latex]
- [latex]n = 400[/latex]
- [latex]\text{Confidence Level} = 90\%[/latex]
- [latex]\alpha = 10\%[/latex]
Question: Can you use CONFIDENCE.T instead, to calculate the lower and upper limits for the 90% confidence interval?
Solution: Click here to download the Excel file shown in the video below.
Click here to reveal the written solutions from the above video
Solving for the Margin of Error (E)
Let us first write out the values needed for CONFIDENCE.T:
- [latex]\alpha = 1-0.90 = 0.10[/latex]
- [latex]s = 0.0019[/latex]
- [latex]n = 400[/latex]
This gives: [latex]E = \text{CONFIDENCE.T}(\alpha, s, n) = \text{CONFIDENCE.T}(0.10, 0.0019, 400) = 0.00015[/latex]
Building up the Confidence Interval
To build the confidence interval, we add and subtract the Margin of Error (E) from the sample mean (x̄):
[latex]CL_{Lower} = \bar{x}-E = 0.6251 - 0.00015 = 0.62495[/latex]
[latex]CL_{Upper} = \bar{x}+E = 0.6251 + 0.00015 = 0.62525[/latex]
Conclusion
There is a 90% chance that the average bolt length is between 0.62495 and 0.62525 inches in length.
Calculating the Required Sample Size (Video)
Let us revisit the first example in this section where we were performing quality control on the hexagon head cap screws. In the case where we need to improve the accuracy of the sample, we will need to increase the sample size. In the next example, we will calculate this new sample size required. The formula is given below:
\[n = \left( \frac{z \cdot s}{E} \right) ^2 \]
Note: We will need to use a [latex]z[/latex]-score instead of a [latex]t[/latex]-score in this calculation. This is partly because we would need a sample size to calculate a [latex]t[/latex]-score but the sample size is exactly what we do not have and need to calculate!
Example 51.4
Problem Setup: The quality control team has stated that the margin of error is too large for your sample of hexagon head cap screws. They would like to reduce this margin of error to 0.002 inches at the 99% confidence level.
Question: How many more screws do they nee to sample in order to achieve this goal?
Solution: Click here to download the Excel file shown in the video below.
Conclusion: We will need to sample an additional 157 screws in order to reduce the margin of error below 0.002 inches.
Click here to reveal the written solutions from the above video
Finding the z-score
We first need to find the z-score required for this calculation:
- [latex]\text{Confidence Level} = 99\%[/latex]
- [latex]\alpha = 1-0.99 = 0.01 = 1\%[/latex]
- [latex]\frac{\alpha}{2} = \frac{0.01}{2} = 0.005[/latex]
- [latex]z = \text{NORM.S.INV}(\frac{\alpha}{2}) = -2.5758[/latex]
We can drop the minus sign and plug the [latex]z[/latex]-score into the sample size formula (although it doesn't make any difference when it is squared in the sample size calculation):
\[n = \left( \frac{z \cdot s}{E} \right) ^2 = \left(\frac{2.5758 \cdot 0.0124}{0.002} \right)^2 = 256.58 \]
We always round [latex]n[/latex] up to the next whole number. This gives the additional number of screws required to be sampled at:
[latex]\text{Additional number sampled} = 257 - 100 = 157[/latex]
Conclusion
An additional 157 screws need to be sampled in order to reduce the margin of error to 0.002 at the 99% confidence level.
