Chapter 4: Community & Population Ecology
4.3 The Human Population
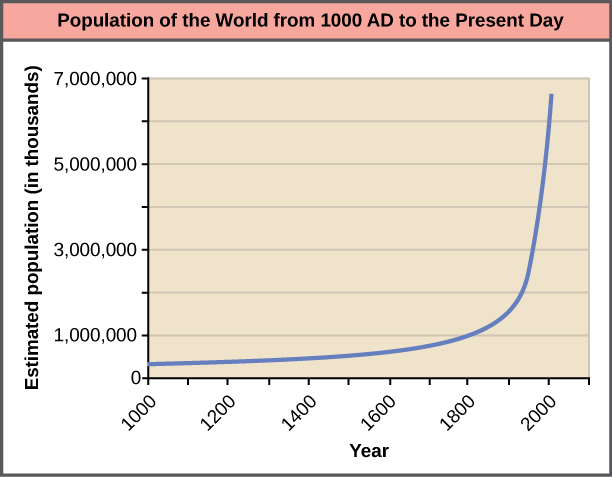
Concepts of animal population dynamics can be applied to human population growth. Humans are not unique in their ability to alter their environment. For example, beaver dams alter the stream environment where they are built. Humans, however, have the ability to alter their environment to increase its carrying capacity, sometimes to the detriment of other species. Earth’s human population and its use of resources are growing rapidly, to the extent that some worry about the ability of Earth’s environment to sustain its human population. Long-term exponential growth carries with it the potential risks of famine, disease, and large-scale death, as well as social consequences of crowding such as increased crime.
Human technology and particularly our harnessing of the energy contained in fossil fuels have caused unprecedented changes to Earth’s environment, altering ecosystems to the point where some may be in danger of collapse. Changes on a global scale including depletion of the ozone layer, desertification and topsoil loss, and global climate change are caused by human activities.
CONCEPT IN ACTION

Click through this interactive view of how human populations have changed over time.
Human population Growth
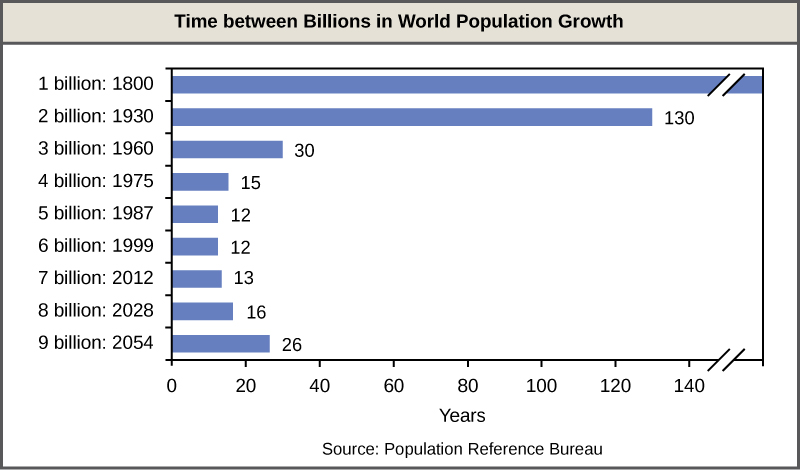
The fundamental cause of the acceleration of growth rate for humans in the past 200 years has been the reduced death rate due to changes in public health and sanitation. Clean drinking water and proper sewage disposal has drastically improved health in developed nations. Also, medical innovations such as the use of antibiotics and vaccines have decreased the ability of infectious disease to limit human population growth. In the past, diseases such as the bubonic plague of the fourteenth century killed between 30 and 60 percent of Europe’s population and reduced the overall world population by as many as one hundred million people. Naturally, infectious disease continues to have an impact on human population growth, especially in poorer nations. For example, life expectancy in sub-Saharan Africa, which was increasing from 1950 to 1990, began to decline after 1985 largely as a result of HIV/AIDS mortality. The reduction in life expectancy caused by HIV/AIDS was estimated to be 7 years for 2005.1
Technological advances of the industrial age have also supported population growth through urbanization and advances in agriculture. These advances in technology were possible, in part, due to the exploitation of fossil fuels.
Age Structure, Population Growth, and Economic Development
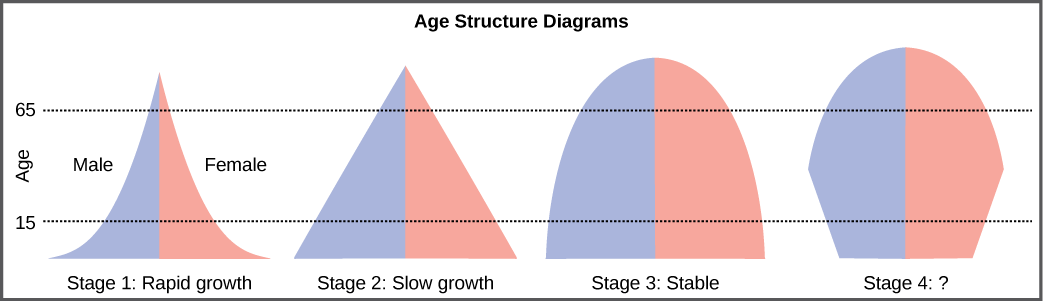
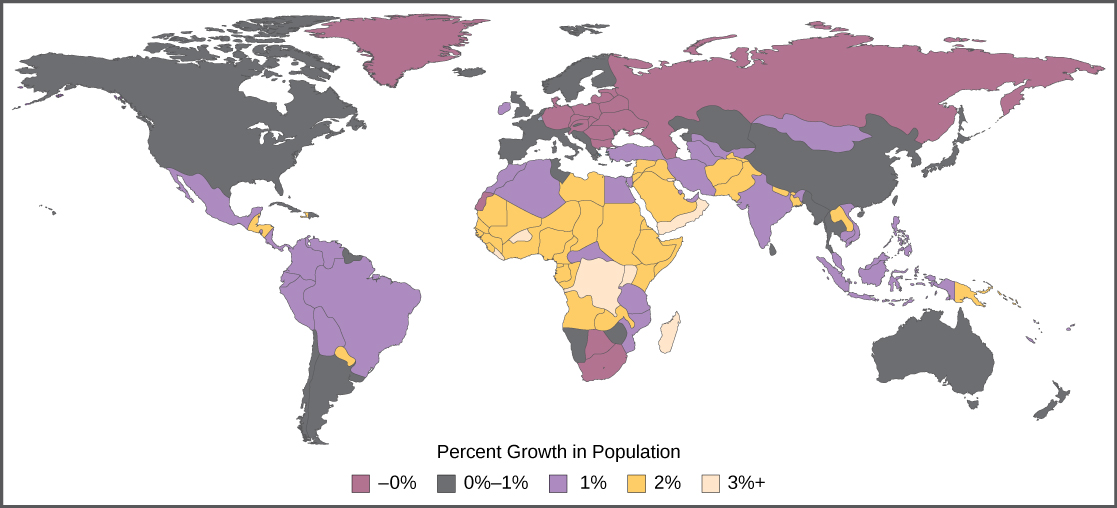
The age structure of a population is an important factor in population dynamics. Age structure is the proportion of a population in different age classes. Models that incorporate age structure allow better prediction of population growth, plus the ability to associate this growth with the level of economic development in a region. Countries with rapid growth have a pyramidal shape in their age structure diagrams, showing a preponderance of younger individuals, many of whom are of reproductive age (Figure 3). This pattern is most often observed in underdeveloped countries where individuals do not live to old age because of less-than-optimal living conditions, and there is a high birth rate. Age structures of areas with slow growth, including developed countries such as the United States, still have a pyramidal structure, but with many fewer young and reproductive-aged individuals and a greater proportion of older individuals. Other developed countries, such as Italy, have zero population growth. The age structure of these populations is more conical, with an even greater percentage of middle-aged and older individuals. The actual growth rates in different countries are shown in Figure 4, with the highest rates tending to be in the less economically developed countries of Africa and Asia.
Long-Term Consequences of Exponential Human Population Growth
“The battle to feed all of humanity is over. In the 1970s hundreds of millions of people will starve to death in spite of any crash programs embarked upon now. At this late date nothing can prevent a substantial increase in the world death rate.”2
CONCEPT IN ACTION

Visit this website and select “Launch the movie” for an animation discussing the global impacts of human population growth.
Footnotes
- Danny Dorling, Mary Shaw, and George Davey Smith, “Global Inequality of Life Expectancy due to AIDS,” BMJ 332, no. 7542 (March 2006): 662-664, doi: 10.1136/bmj.332.7542.662.
- Paul R. Erlich, prologue to The Population Bomb, (1968; repr., New York: Ballantine, 1970).
Attribution
Human Population Growth by OpenStax is licensed under CC BY 4.0. Modified from the original.
