CHAPTER 6 Linear Equations and Graphing
6.2 Graph Linear Equations in Two Variables
Learning Objectives
By the end of this section, you will be able to:
- Recognize the relationship between the solutions of an equation and its graph.
- Graph a linear equation by plotting points.
- Graph vertical and horizontal lines.
Recognize the Relationship Between the Solutions of an Equation and its Graph
In the previous section, we found several solutions to the equation  . They are listed in the table below. So, the ordered pairs
  ,
,  , and
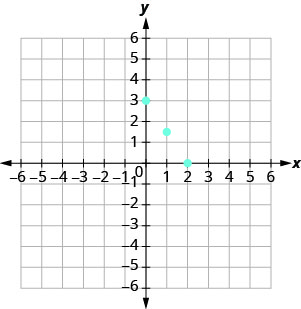
, and  are some solutions to the equation . We can plot these solutions in the rectangular coordinate system as shown in (Figure 1).
|
||
 |
 |
 |
| 0 | 3 | |
| 2 | 0 | |
| 1 |  |
|
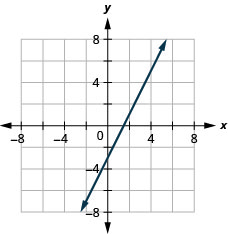
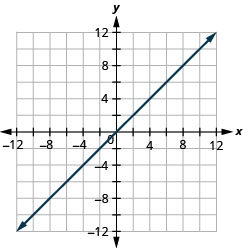
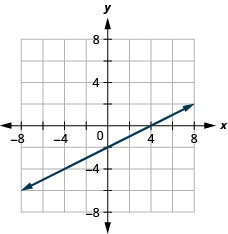
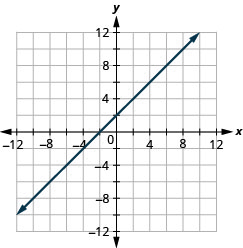
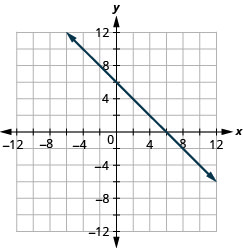
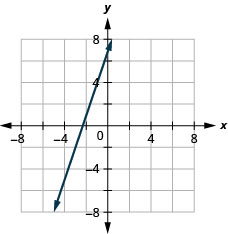
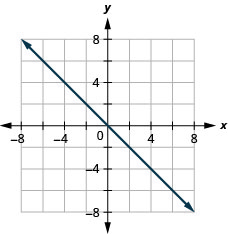
Notice how the points line up perfectly? We connect the points with a line to get the graph of the equation . See (Figure 2). Notice the arrows on the ends of each side of the line. These arrows indicate the line continues.
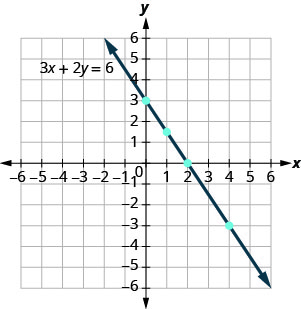
Every point on the line is a solution of the equation. Also, every solution of this equation is a point on this line. Points not on the line are not solutions.
Notice that the point whose coordinates are  is on the line shown in (Figure 3). If you substitute
  and
and  into the equation, you find that it is a solution to the equation.
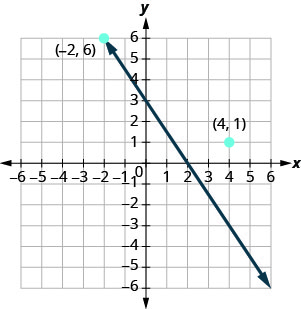
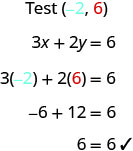
So the point is a solution to the equation . (The phrase “the point whose coordinates are ” is often shortened to “the point .”)
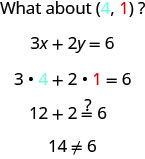
So  is not a solution to the equation . Therefore, the point is not on the line. See (Figure 2). This is an example of the saying, “A picture is worth a thousand words.” The line shows you all the solutions to the equation. Every point on the line is a solution of the equation. And, every solution of this equation is on this line. This line is called the graph of the equation .
Graph of a linear equation
The graph of a linear equation  is a line.
- Every point on the line is a solution of the equation.
- Every solution of this equation is a point on this line.
EXAMPLE 1
The graph of  is shown.
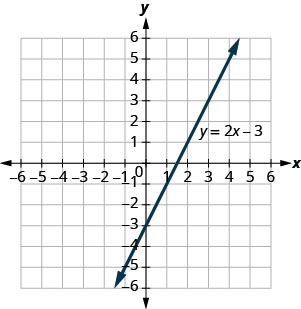
For each ordered pair, decide:
a) Is the ordered pair a solution to the equation?
b) Is the point on the line?
A  B
B  C
C  D
D 
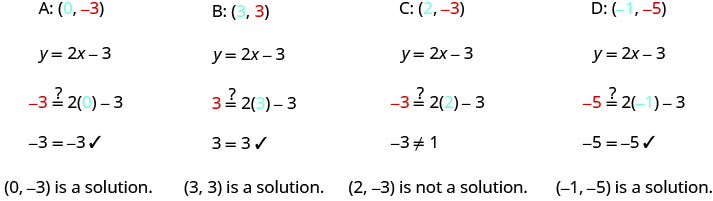
Solution
Substitute the x– and y– values into the equation to check if the ordered pair is a solution to the equation.
-
- Plot the points A , B , C , and D .
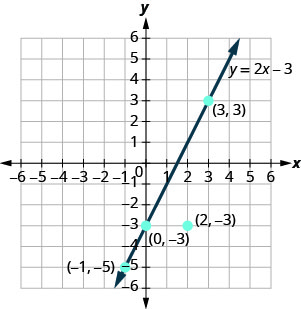
The points , , and are on the line , and the point is not on the line.
The points that are solutions to are on the line, but the point that is not a solution is not on the line.
TRY IT 1.1
Use the graph of  to decide whether each ordered pair is:
- a solution to the equation.
- on the line.
a)  b)
b) 
Show answer
a) yes, yes b) yes, yes
TRY IT 1.2
Use graph of to decide whether each ordered pair is:
- a solution to the equation
- on the line
a)  b)
b) 
Show answer
a) no, no b) yes, yes
Graph a Linear Equation by Plotting Points
There are several methods that can be used to graph a linear equation. The method we used to graph is called plotting points, or the Point–Plotting Method.
EXAMPLE 2
Graph the equation  by plotting points.
TRY IT 2.1
Graph the equation by plotting points: .
Show answer
TRY IT 2.2
Graph the equation by plotting points:  .
.
Show answer

HOW TO: Graph a linear equation by plotting points.
The steps to take when graphing a linear equation by plotting points are summarized below.
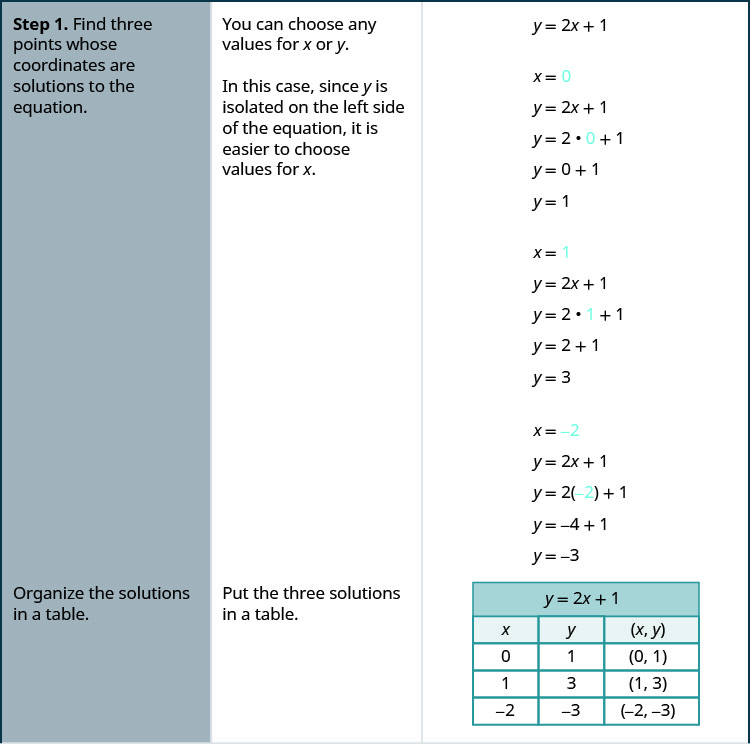
- Find three points whose coordinates are solutions to the equation. Organize them in a table.
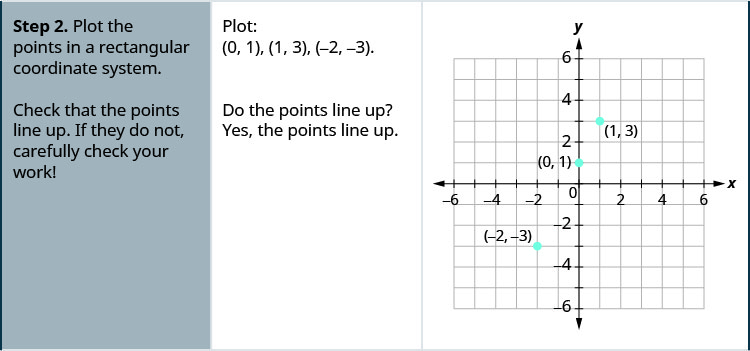
- Plot the points in a rectangular coordinate system. Check that the points line up. If they do not, carefully check your work.
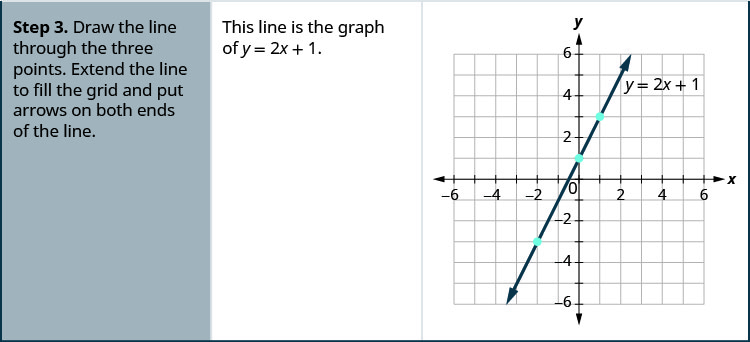
- Draw the line through the three points. Extend the line to fill the grid and put arrows on both ends of the line.
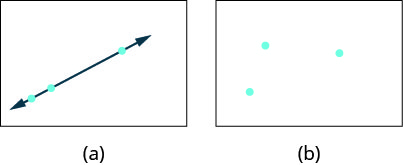
It is true that it only takes two points to determine a line, but it is a good habit to use three points. If you only plot two points and one of them is incorrect, you can still draw a line but it will not represent the solutions to the equation. It will be the wrong line.
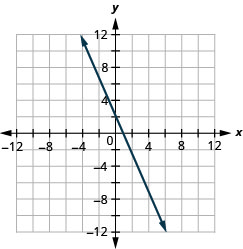
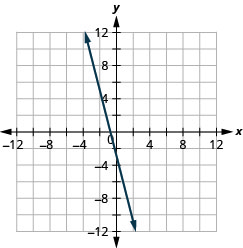
If you use three points, and one is incorrect, the points will not line up. This tells you something is wrong and you need to check your work. Look at the difference between part (a) and part (b) in (Figure 4).
Let’s do another example. This time, we’ll show the last two steps all on one grid.
EXAMPLE 3
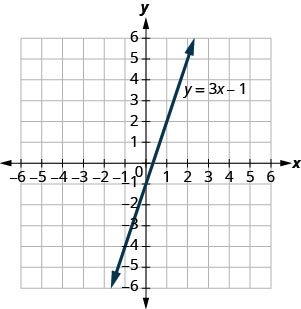
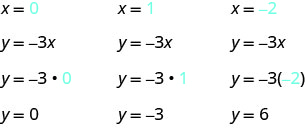
Graph the equation  .
.
Solution
Find three points that are solutions to the equation. Here, again, it’s easier to choose values for . Do you see why?
We list the points in the table below.
|
||
|
|
|
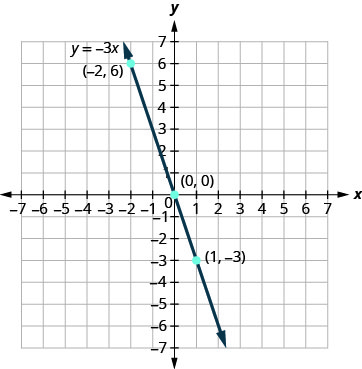
| 0 | 0 |  |
| 1 |  |
 |
 |
6 | |
Plot the points, check that they line up, and draw the line.
TRY IT 3.1
Graph the equation by plotting points:  .
.
Show answer

EXAMPLE 3.2
Graph the equation by plotting points:  .
.
Show answer
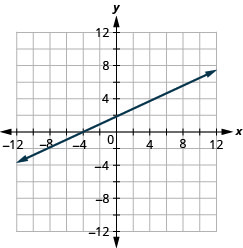
When an equation includes a fraction as the coefficient of , we can still substitute any numbers for . But the math is easier if we make ‘good’ choices for the values of . This way we will avoid fraction answers, which are hard to graph precisely.
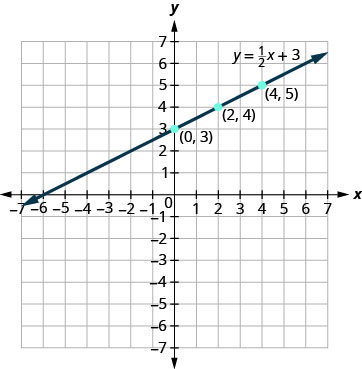
EXAMPLE 4
Graph the equation  .
.
Find three points that are solutions to the equation. Since this equation has the fraction  as a coefficient of , we will choose values of carefully. We will use zero as one choice and multiples of 2 for the other choices. Why are multiples of 2 a good choice for values of ?
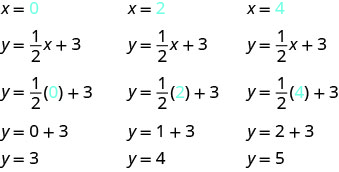
The points are shown in the table below.
|
||
|
|
|
| 0 | 3 | |
| 2 | 4 |  |
| 4 | 5 |  |
Plot the points, check that they line up, and draw the line.
TRY IT 4. 1
Graph the equation  .
.
Show answer
TRY IT 4.2
Graph the equation  .
.
Show answer
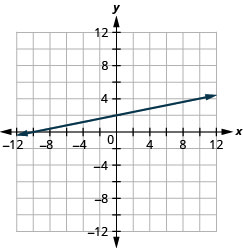
So far, all the equations we graphed had given in terms of . Now we’ll graph an equation with and on the same side. Let’s see what happens in the equation  . If
. If  what is the value of ?
This point has a fraction for the x– coordinate and, while we could graph this point, it is hard to be precise graphing fractions. Remember in the example , we carefully chose values for so as not to graph fractions at all. If we solve the equation for , it will be easier to find three solutions to the equation.

The solutions for  ,
,  , and
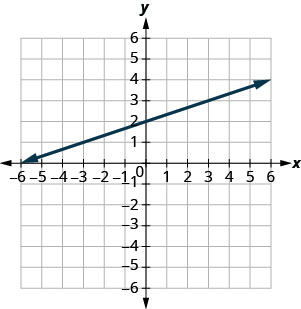
, and  are shown in the table below. The graph is shown in (Figure 5).
|
||
|
|
|
| 0 | 3 | |
| 1 | 1 |  |
 |
5 |  |
Can you locate the point  , which we found by letting , on the line?
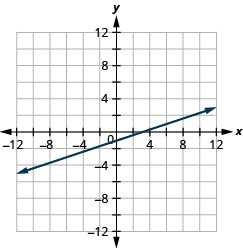
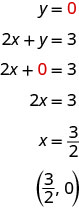
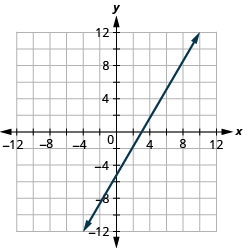
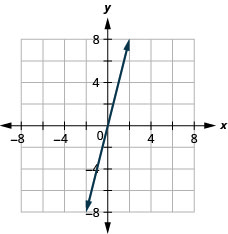
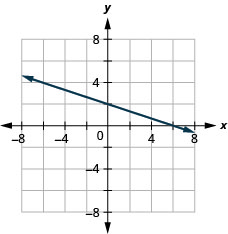
EXAMPLE 5
Graph the equation  .
.
| Find three points that are solutions to the equation. |  |
| First, solve the equation for . |
 |
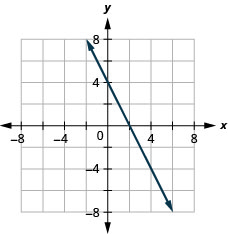
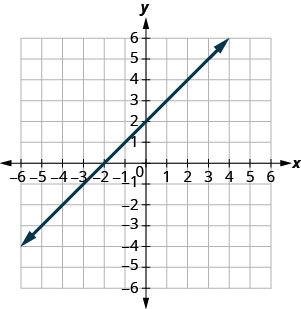
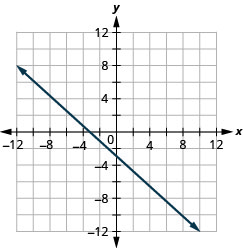
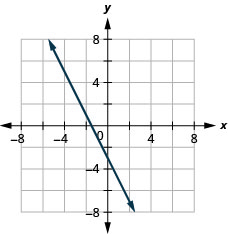
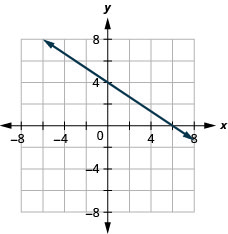
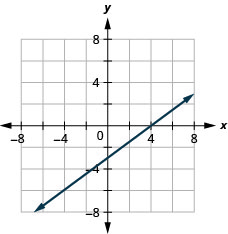
We’ll let be 0, 1, and to find 3 points. The ordered pairs are shown in the table below. Plot the points, check that they line up, and draw the line. See (Figure 6).
|
||
|
|
|
| 0 | |
|
| 1 |  |
 |
|
2 |  |
EXAMPLE 5.1
Graph the equation  .
.
Show answer
TRY IT 5.2
Graph the equation  .
.
Show answer
If you can choose any three points to graph a line, how will you know if your graph matches the one shown in the answers in the book? If the points where the graphs cross the x– and y-axis are the same, the graphs match!
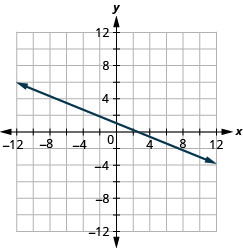
The equation in (Example 5) was written in standard form, with both and on the same side. We solved that equation for in just one step. But for other equations in standard form it is not that easy to solve for , so we will leave them in standard form. We can still find a first point to plot by letting and solving for . We can plot a second point by letting and then solving for . Then we will plot a third point by using some other value for or .
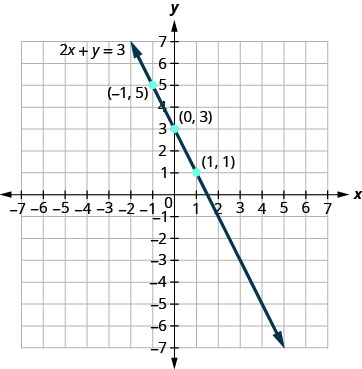
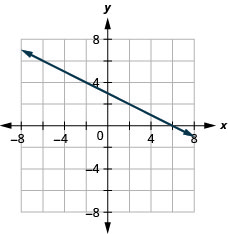
EXAMPLE 6
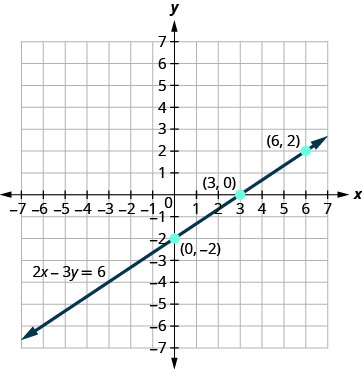
Graph the equation  .
.
| Find three points that are solutions to the equation. |  |
| First, let . |
 |
| Solve for . |
 |
| Now let . |
 |
| Solve for . |
 |
We need a third point. Remember, we can choose any value for or . We’ll let  . . |
 |
| Solve for . |
 |
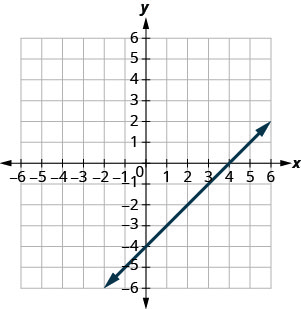
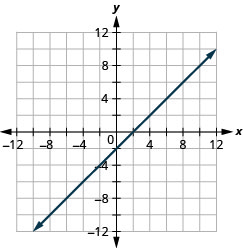
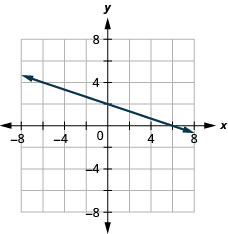
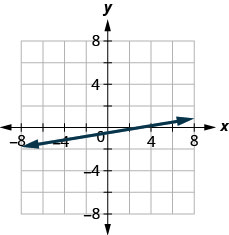
We list the ordered pairs in the table below. Plot the points, check that they line up, and draw the line. See (Figure 7).
|
||
|
|
|
| 0 | |
 |
| 3 | 0 |  |
| 6 | 2 |  |
TRY IT 6.1
Graph the equation  .
.
Show answer
TRY IT 6.2
Graph the equation  .
.
Show answer
Graph Vertical and Horizontal Lines
Can we graph an equation with only one variable? Just and no , or just without an ? How will we make a table of values to get the points to plot?
Let’s consider the equation  . This equation has only one variable, . The equation says that is always equal to , so its value does not depend on . No matter what is, the value of is always .
So to make a table of values, write in for all the values. Then choose any values for . Since does not depend on , you can choose any numbers you like. But to fit the points on our coordinate graph, we’ll use 1, 2, and 3 for the y-coordinates. See the table below.
|
||
|
|
|
|
1 |  |
|
2 |  |
|
3 |  |
Plot the points from the table and connect them with a straight line. Notice in (Figure 8) that we have graphed a vertical line.
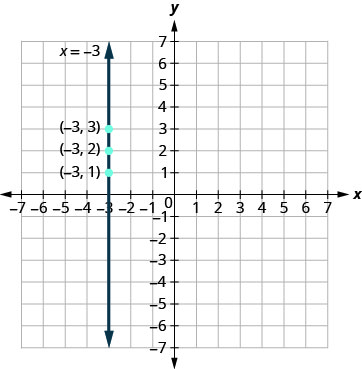
Vertical line
A vertical line is the graph of an equation of the form  .
.
The line passes through the x-axis at  .
.
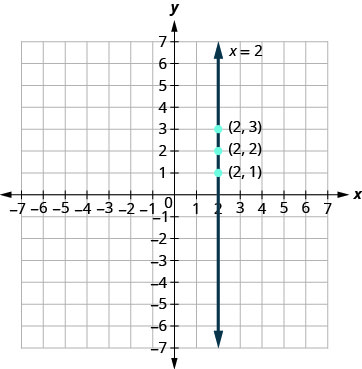
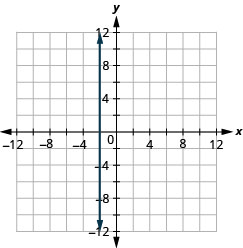
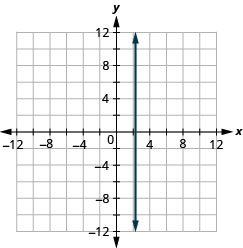
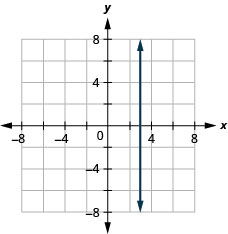
EXAMPLE 7
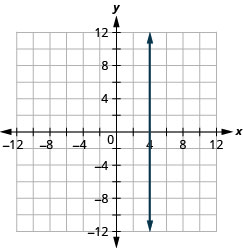
Graph the equation  .
.
The equation has only one variable, , and is always equal to 2. We create the table below where is always 2 and then put in any values for . The graph is a vertical line passing through the x-axis at 2. See (Figure 9).
|
||
|
|
|
| 2 | 1 |  |
| 2 | 2 |  |
| 2 | 3 |  |
TRY IT 7.1
Graph the equation  .
.
Show answer
TRY IT 7.2
Graph the equation .
Show answer
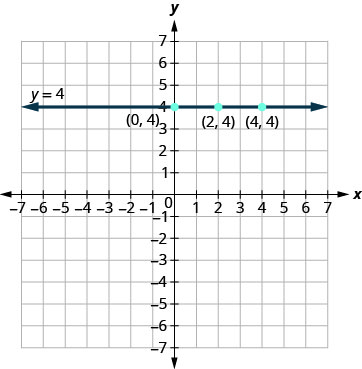
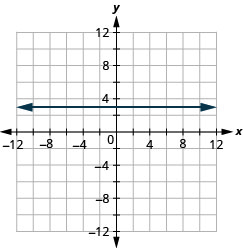
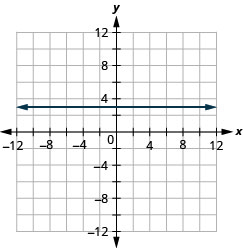
What if the equation has but no ? Let’s graph the equation  . This time the y– value is a constant, so in this equation, does not depend on . Fill in 4 for all the ’s in the table below and then choose any values for . We’ll use 0, 2, and 4 for the x-coordinates.
|
||
|
|
|
| 0 | 4 |  |
| 2 | 4 | |
| 4 | 4 |  |
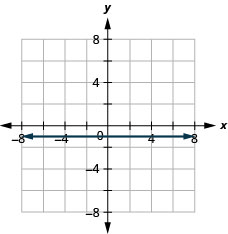
The graph is a horizontal line passing through the y-axis at 4. See (Figure 10).
Horizontal line
A horizontal line is the graph of an equation of the form  .
.
The line passes through the y-axis at  .
.
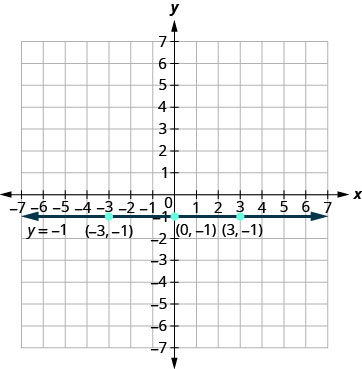
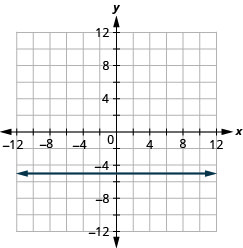
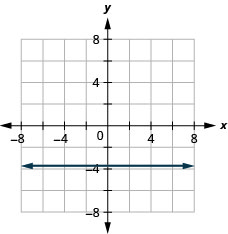
EXAMPLE 8
Graph the equation  .
.
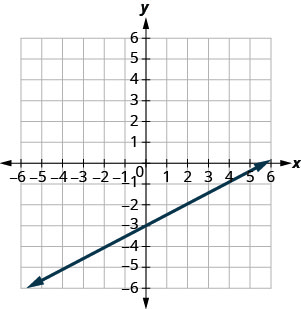
The equation has only one variable, . The value of is constant. All the ordered pairs in the table below have the same y-coordinate. The graph is a horizontal line passing through the y-axis at , as shown in (Figure 11).
|
||
|
|
|
| 0 | |
|
| 3 | |
|
|
|
 |
TRY IT 8.1
Graph the equation  .
.
Show answer
TRY IT 8.2
Graph the equation  .
.
Show answer
The equations for vertical and horizontal lines look very similar to equations like  . What is the difference between the equations and ?
The equation has both and . The value of depends on the value of . The y-coordinate changes according to the value of . The equation has only one variable. The value of is constant. The y-coordinate is always 4. It does not depend on the value of . See the table below.
|
|
|||||
|
|
|
|
|
|
|
| 0 | 0 | |
0 | 4 | |
|
| 1 | 4 |  |
1 | 4 | |
|
| 2 | 8 |  |
2 | 4 | |
|
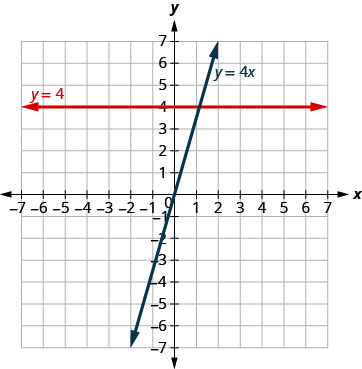
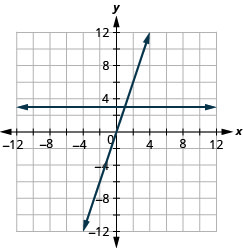
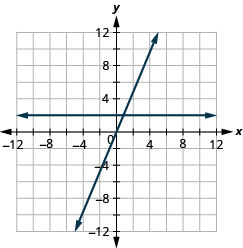
Notice, in (Figure 12), the equation gives a slanted line, while gives a horizontal line.
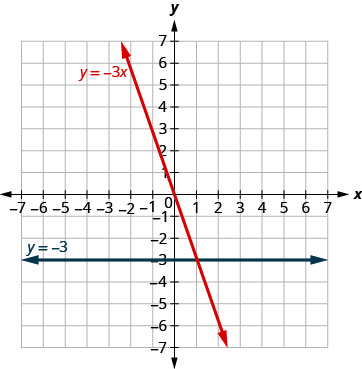
EXAMPLE 9
Graph and  in the same rectangular coordinate system.
Notice that the first equation has the variable , while the second does not. See the table below. The two graphs are shown in (Figure 13).
|
|
|||||
|
|
|
|
|
|
|
| 0 | 0 | |
0 | |
|
|
| 1 | |
|
1 | |
|
|
| 2 |  |
 |
2 | |
|
|
TRY IT 9.1
Graph and in the same rectangular coordinate system.
Show answer
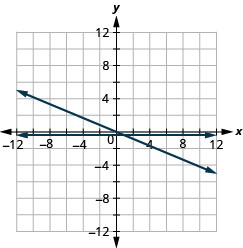
TRY IT 9.2
Graph and  in the same rectangular coordinate system.
Show answer
Key Concepts
- Graph a Linear Equation by Plotting Points
- Find three points whose coordinates are solutions to the equation. Organize them in a table.
- Plot the points in a rectangular coordinate system. Check that the points line up. If they do not, carefully check your work!
- Draw the line through the three points. Extend the line to fill the grid and put arrows on both ends of the line.
Glossary
- graph of a linear equation
- The graph of a linear equation is a straight line. Every point on the line is a solution of the equation. Every solution of this equation is a point on this line.
- horizontal line
- A horizontal line is the graph of an equation of the form . The line passes through the y-axis at .
- vertical line
- A vertical line is the graph of an equation of the form . The line passes through the x-axis at .
Practice Makes Perfect
Recognize the Relationship Between the Solutions of an Equation and its Graph
In the following exercises, for each ordered pair, decide:
a) Is the ordered pair a solution to the equation? b) Is the point on the line?
1. 
a)
|
2. a)
|
|
3. a)
|
4. a)
|


Graph a Linear Equation by Plotting Points
In the following exercises, graph by plotting points.
| 5. |
6.  |
7.  |
8.  |
| 9. |
10.  |
11.  |
12.  |
13.  |
14. |
| 15. |
16.  |
17.  |
18. |
19.  |
20.  |
21.  |
22.  |
23.  |
24.  |
25.  |
26.  |
27.  |
28. |
29.  |
30.  |
31.  |
32.  |
33.  |
34.  |
35.  |
36.  |
37.  |
38.  |
39.  |
40.  |
41.  |
42.  |
43.  |
44.  |
45.  |
46.  |
47.  |
48.  |
Graph Vertical and Horizontal Lines
In the following exercises, graph each equation.
49.  |
50.  |
| 51. |
52.  |
| 53. |
54.  |
55.  |
56.  |
57.  |
58.  |
59.  |
60.  |
In the following exercises, graph each pair of equations in the same rectangular coordinate system.
61. and  |
62.  and and  |
63.  and and  |
64.  and and  |
Mixed Practice
In the following exercises, graph each equation.
| 65. |
66. |
67.  |
68.  |
69.  |
70. |
71.  |
72.  |
73.  |
74.  |
| 75. |
76. |
77.  |
78.  |
| 79. |
80.  |
Everyday Math
81. Motor home cost. The Stonechilds rented a motor home for one week to go on vacation. It cost them $594 plus $0.32 per mile to rent the motor home, so the linear equation  gives the cost, , for driving miles. Calculate the rental cost for driving 400, 800, and 1200 miles, and then graph the line. gives the cost, , for driving miles. Calculate the rental cost for driving 400, 800, and 1200 miles, and then graph the line. |
82. Weekly earnings. At the art gallery where he works, Archisma gets paid $200 per week plus 15% of the sales he makes, so the equation  gives the amount, , he earns for selling dollars of artwork. Calculate the amount Archisma earns for selling $900, $1600, and $2000, and then graph the line. gives the amount, , he earns for selling dollars of artwork. Calculate the amount Archisma earns for selling $900, $1600, and $2000, and then graph the line. |
Writing Exercises
83. Explain how you would choose three x– values to make a table to graph the line  . . |
84. What is the difference between the equations of a vertical and a horizontal line? |
Answers
| 1. a) yes; no b) no; no c) yes; yes d) yes; yes | 3. a) yes; yes b) yes; yes c) yes; yes d) no; no |
| 5.
|
7.
|
| 9.
|
11.
|
| 13.
|
15.
|
| 17.
|
19.
|
| 21.
|
23.
|
| 25.
|
27.
|
| 29.
|
31.
|
| 33.
|
35.
|
|
37.
|
39. *ANSWER GRAPH LOOKS OFF; ie. graph should have m=2/5, not (-2/5). |
| 41.
|
43.
|
| 45.
|
47.
|
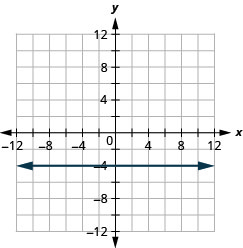
| 49.
|
51.
|
| 53.
|
55.
|
| 57.
|
59.
|
| 61.
|
63.
|
| 65.
|
67.
|
| 69.
|
71.
|
| 73.
|
75.
|
| 77.
|
79.
|
81. $722, $850, $978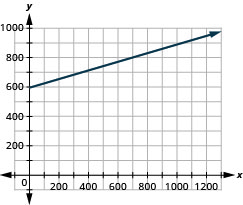 |
83. Answers will vary. |

Attributions
This chapter has been adapted from “Graph Linear Equations in Two Variables” in Elementary Algebra (OpenStax) by Lynn Marecek and MaryAnne Anthony-Smith, which is under a CC BY 4.0 Licence. Adapted by Izabela Mazur. See the Copyright page for more information.
