CHAPTER 6 Linear Equations and Graphing
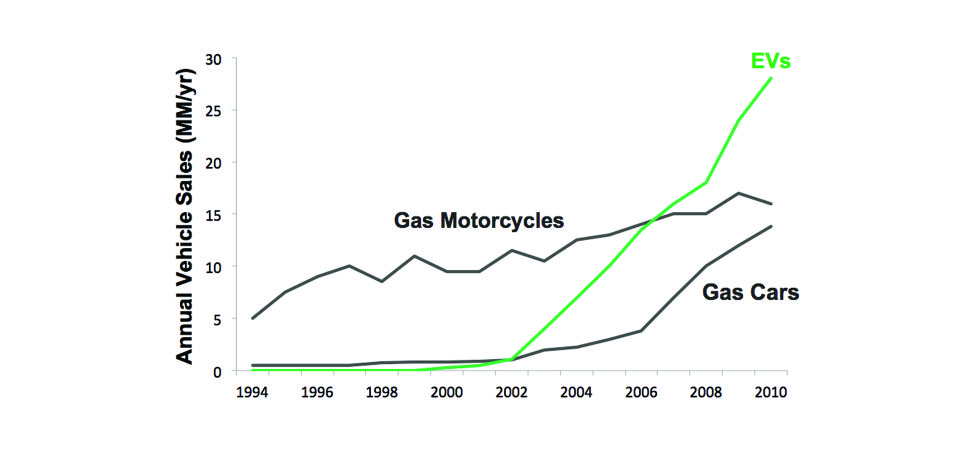
This graph illustrates the annual vehicle sales of gas motorcycles, gas cars, and electric vehicles from 1994 to 2010. It is a line graph with x– and y-axes, one of the most common types of graphs. (credit: Steve Jurvetson, Flickr)
 Graphs are found in all areas of our lives—from commercials showing you which cell phone carrier provides the best coverage, to bank statements and news articles, to the boardroom of major corporations. In this chapter, we will study the rectangular coordinate system, which is the basis for most consumer graphs. We will look at linear graphs, slopes of lines, and equations of lines.
Attributions
This chapter has been adapted from the “Introduction” in Chapter 4 of Elementary Algebra (OpenStax) by Lynn Marecek and MaryAnne Anthony-Smith, which is under a CC BY 4.0 Licence. Adapted by Izabela Mazur. See the Copyright page for more information.
