Section 1.1: Organizing Data
Section Learning Objectives
- Describe in very general terms what statistics is all about.
- Identify the “who, what, when, where, why, and how” of data.
- Define what is meant by a variable in statistics.
- Identify a variable as categorical or numerical.
- Distinguish between the name of a variable and the values that a variable can assume.
- Identify the units used for a numerical variable.
Section Checklist
| Learning activity | Graded? | Estimated time |
|---|---|---|
| Read OpenIntro Statistics sections 1.1 and 1.2 and supplementary notes | No | 45 mins |
| Watch instructional videos | No | 15 mins |
| Answer two section check-in questions | Yes | 15 mins |
| Work through virtual statistical software lab | No | 45 mins |
| Answer two virtual statistical software lab questions | Yes | 15 mins |
| Work on practice exercises | No | 2 hours |
| Explore suggested websites | No | 45 mins |
Learning Activities
Readings 📖
- Obtain the OpenIntro Statistics textbook [link to section in Course Guide with instructions for how to do this] and read the Preface. Yes, really 😁. There’s useful information here that will benefit you as you move through the course. In particular, you’ll see a good overview of the topics covered in the course and learn how examples and guided practice exercises are woven into the text. Answers to guided practice exercises are provided in footnotes at the bottom of the page.
- Read OpenIntro Statistics Section 1.1: Case study: using stents to prevent strokes. This application provides a good motivation for why you’re studying statistics. Self-assess your understanding while you read by attempting the guided practice exercise.
- Read OpenIntro Statistics Section 1.2: Data basics. Here you’ll learn how to effectively organize and describe data prior to analysis. There’s a lot of terminology in this section, which you can look up at any time in the course in the Glossary. Again, self-assess your understanding while you read by attempting the guided practice exercises.
- Read the Supplementary Notes further down this page.
Instructional Videos 🎦
OpenIntro Statistics Video 1.1 – Using stents to prevent strokes (4:29)
OpenIntro Statistics Video 1.2 – Data basics (4:14)
Section Check-in Questions
Answer the two check-in questions for Section 1.1 in your Moodle course. The questions are based on the material covered in the readings and instructional videos. The questions are multiple choice, fill-in-the blank, matching, or number questions and are auto-graded in Moodle. Once you access the questions you have 15 minutes to submit your answers, which will count 0.25% towards your overall grade.
Virtual Statistical Software Lab 💻
Work through the virtual statistical software lab: Introduction to jamovi. This will introduce you to jamovi, which is free, easy-to-use, open source software for conducting statistical analysis. You’ll be using this software to carry out all the statistical analyses covered in the course. This lab will show you how to download and run the software and explore reading in data and basic commands for working with data in jamovi. The lab should take you no more than 45 minutes to complete.
Virtual Statistical Software Lab Questions
Answer the two virtual statistical software lab questions for Section 1.1 in your Moodle course. The questions are based on the lab you just completed. The questions are multiple choice, fill-in-the blank, matching, or number questions and are auto-graded in Moodle. Once you access the questions you have 15 minutes to submit your answers, which will count 0.25% towards your overall grade.
Practice Exercises 🖊
- Work on the following exercises in OpenIntro Statistics Exercises 1.1, 1.3, 1.5, 1.7, 1.9, and 1.11 and Chapter Exercies 1.43 [add link to PDF containing exercises]. Check your answers using the solutions provided in Appendix A of OpenIntro Statistics. You’ll deepen your understanding much more effectively if you genuinely attempt the questions by yourself before checking the solutions.
- Work on the following exercises on [WeBWorK or LibreTexts Adapt]: [link to be added]. Check your answers using the solutions provided.
Suggested Websites 🌎
- to be added
Supplementary Notes
Introduction
What’s the most basic ingredient of any statistical study?
Data.
What are data?
Information––numerical or categorical––recorded with a context to give it meaning.
How do we identify context?
Answer the “5 W’s plus H,” that is the “Who, What, When, Where, Why, and How” if possible.
Example
In the following data table, the most important “Who” and “What” can be identified, but without more information we really can’t answer the “When,” “Where,” “Why,” and “How.”
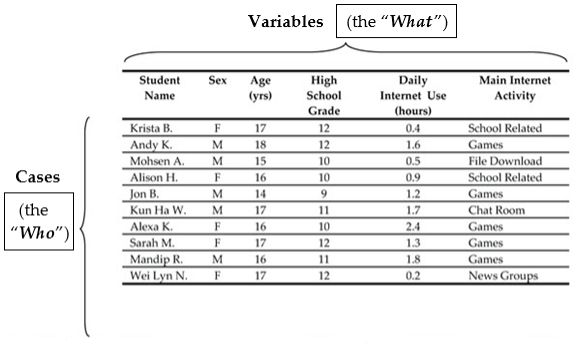
In statistics, what is a variable?
A variable is a characteristic of a subject (or more generally, an experimental unit) whose value varies from case to case.
What are the two types of variables?
- Categorical (qualitative)—values are categories
- Numerical (quantitative)—values are numbers
For the example in the previous data table, identify the variables and their types.
Categorical
- Student Name
- Sex
- Main Internet Activity
Numerical
- Age
- High School Grade
- Daily Internet Use Time
What’s meant by the values of a variable?
The values of a variable are the specific categories (for categorical variables) or numbers (for numerical variables) that the variable can take on.
Example
- Categorical variable: “eye colour of humans.” Possible values: brown, blue, green, black, …
- Numerical variable: “number of children in the family.” Possible values: 0, 1, 2, 3, … children.
Do numerical variables always have units?
Absolutely, and it’s very important that you include the units whenever you quote values of the variable.
Example
- Numerical variable: Cost of a home in Whistler, BC
- Possible values: 545,000 dollars, $780,000, 1.2 million dollars
Example: Identifying “Five W’s plus H”
Later in the course, we’ll often look at abstracts (summaries) of studies that have been published in various health science journals. The following is an example of an abstract that was published in the Yonsei Medical Journal and is available in the TRU Library.
How many of the “Five W’s plus H” can we identify from the abstract?
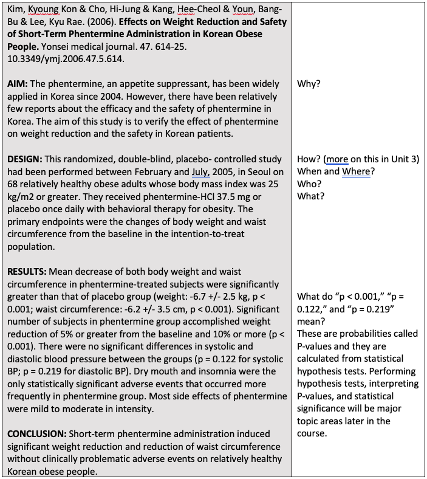
There are six variables (the Whats) reported in the abstract.
- “Treatment received”—categorical with values “phentermine” and “placebo”
- “Decrease in body weight”—numerical—units are kg
- “Decrease in waist circumference”—numerical—units are cm
- “Difference in systolic blood pressure”—numerical—units are mmHg
- “Difference in diastolic blood pressure”—numerical—units are mmHg
- “Adverse events”—categorical with values “dry mouth” and “insomnia” given in abstract
