Main Body
Chapter 2: Introduction to Vulnerability and Risk (Excerpt from – At Risk: natural hazards, people’s vulnerability and disasters (2nd edition))

2003
Copyright Wisner, Blaikie, Cannon and Davis
The attached three chapters constitute Part I of the book, and have been made available in the public domain by the authors and Routledge as part of the UNDP follow up to the Hyogo Framework for Action 2005.
Royalties for the print versions of the book are donated to three disaster reduction networks in the South: La Red (Latin America), Duryog Nivaran (South Asia) and Peri-Peri (Southern Africa)
What is vulnerability?
The basic idea and some variations
We have already used the term vulnerability a number of times. It has a commonplace meaning: being prone to or susceptible to damage or injury. Our book is an attempt to refine this common-sense meaning in relation to natural hazards. To begin, we offer a simple working definition. By vulnerability we mean the characteristics of a person or group and their situation that influence their capacity to anticipate, cope with, resist and recover from the impact of a natural hazard (an extreme natural event or process). It involves a combination of factors that determine the degree to which someone’s life, livelihood, property and other assets are put at risk by a discrete and identifiable event (or series or ‘cascade’ of such events) in nature and in society.
Some groups are more prone to damage, loss and suffering in the context of differing hazards. Key variables explaining variations of impact include class (which includes differences in wealth), occupation, caste, ethnicity, gender, disability and health status, age and immigration status (whether ‘legal’ or ‘illegal’), and the nature and extent of social networks. The concept of vulnerability clearly involves varying magnitudes: some people experience higher levels than others. But we use the term to mean those who are more at risk: when we talk of vulnerable people, it is clear that we mean those who are at the ‘worse’ end of the spectrum. When used in this sense, the implied opposite of being vulnerable is sometimes indicated by our use of the term ‘secure’. Other authors complement the discussions of vulnerability with the notion of ‘capacity’ – the ability of a group or household to resist a hazard’s harmful effects and to recover easily (Anderson and Woodrow 1998; Eade 1998; IFRC 1999b; Wisner 2003a).
It should also be clear that our definition of vulnerability has a time dimension built into it: vulnerability can be measured in terms of the damage to future livelihoods, and not just as what happens to life and property at the time of the hazard event. Vulnerable groups are also those that also find it hardest to reconstruct their livelihoods following disaster, and this in turn makes them more vulnerable to the effects of subsequent hazard events. The word ‘livelihood’ is important in the definition. We mean by this the command an individual, family or other social group has over an income and/or bundles of resources that can be used or exchanged to satisfy its needs. This may involve information, cultural knowledge, social networks and legal rights as well as tools, land or other physical resources. Later we develop this livelihood aspect of vulnerability in an ‘Access model’. The Access model analyses the ability of people to deal with the impact of the hazards they face in terms of what level of access they have (or do not have) to the resources needed for their livelihoods before and after a hazard’s impact .
Our focus on vulnerable people leads us to give secondary consideration to natural events as determinants of disasters. Normally, vulnerability is closely correlated with socio-economic position (assuming that this incorporates race, gender, age, etc.). Although we make a number of distinctions that show it to be too simplistic to explain all disasters, in general the poor suffer more from hazards than do the rich. Although vulnerability cannot be read directly off from poverty, the two are often very highly correlated. The key point is that even a straightforward analysis on the basis of poverty and wealth as determinants of vulnerability illustrates the significance we want to attach to social forms of disaster explanation. For example, heavy rainfall may wash away the homes in wealthy hillside residential areas of California, such as Topanga Canyon (in greater Los Angeles) or the Oakland–Berkeley hills (near San Francisco), just as it does those of the poor in Rio de Janeiro (Brazil) or Caracas (Venezuela).
There are three important differences, however, between the vulnerability of the rich and the poor in such cases. Firstly, few rich people are affected if we compare the number of victims of landslides in various cities around the world. Money can buy design and engineering that minimises (but of course does not eliminate) the frequency of such events for the rich, even if they are living on an exposed slope.
Secondly, living in the hazardous canyon environment is a choice made by some of the rich in California, but not by the poor Brazilian or Philippine job seekers who live in hillside slums or on the edge of waste dumps. Without entering the psychological or philosophical definitions of ‘voluntary’ versus ‘involuntary’ risk taking (see Sjöberg 1987; Adams 1995; Caplan 2000), it should be clear that slum dwellers’ occupancy of hillsides is less voluntary than that of the corporate executive who lives in Topanga Canyon ‘for the view’. The urban poor use their location as the base for organising livelihood activities (e.g. casual labour, street trading, crafts, crime, prostitution). If the structure of urban land ownership and rent means that the closest they can get to economic opportunities is a hillside slum, people will locate there almost regardless of the landslide risk (Hardoy and Satterthwaite 1989; Fernandes and Varley 1998). This, we will argue, is a situation in which neither ‘voluntary choice’ models nor the notion of ‘bounded rationality’ (Burton et al. 1993: 61–65) are applicable.
Thirdly, the consequences of a landslide for the rich are far less severe than for the surviving poor. The homes and possessions of the rich are usually insured, and they can more easily find alternative shelter and continue with income earning activities after the hazard impact. They often also have reserves and credit. The poor, by contrast, frequently have their entire stock of capital (home, clothing, tools for artisan handicraft production, etc.) assembled at the site of the disaster. They have few if any cash reserves and are generally not considered creditworthy (despite the rapid development of ‘micro-credit’ schemes in a number of countries). Moreover, as emphasised above, the location of a residence itself is a livelihood resource for the urban poor. In places where workers have to commute to work over distances similar to those habitually covered by the middle class, transport can absorb a large proportion of the budget for a low income household. The poor self employed or casually employed underclass finds such transport expenses onerous. It is therefore not surprising that large numbers of working class Mexicans affected by the 1985 earthquake refused to be relocated to the outskirts of Mexico City (Robinson et al. 1986; Poniatowska 1998; da Cruz 1993; Olson et al. 1999; Olson 2000).
The nature of vulnerability
In evaluating disaster risk, the social production of vulnerability needs to be considered with at least the same degree of importance that is devoted to understanding and addressing natural hazards. Expressed schematically, our view is that the risk faced by people must be seen as a cross-cutting combination of vulnerability and hazard. Disasters are a result of the interaction of both; there cannot be a disaster if there are hazards but vulnerability is (theoretically) nil, or if there is a vulnerable population but no hazard event.1
‘Hazard’ refers to the natural events that may affect different places singly or in combination (coastlines, hillsides, earthquake faults, savannahs, rainforests, etc.) at different times (season of the year, time of day, over return periods of different duration). The hazard has varying degrees of intensity and severity.2 Although our knowledge of physical causal mechanisms is incomplete, some long accumulations of records (for example of hurricanes, earthquakes, snow avalanches or droughts) allows us to specify the statistical likelihood of many hazards in time and space. But such knowledge, while necessary, is far from sufficient for calculating the actual level of risk.
What we are arguing is that the risk of disaster is a compound function of the natural hazard and the number of people, characterised by their varying degrees of vulnerability to that specific hazard, who occupy the space and time of exposure to the hazard event. There are three elements here: risk (disaster), vulnerability, and hazard, whose relations we find it convenient to schematise in a pseudo-equation:
R = H x V.
Alexander (2000: 13) distinguished between risk and vulnerability, noting that ‘vulnerability refers to the potential for casualty, destruction, damage, disruption or other form of loss in a particular element: risk combines this with the probable level of loss to be expected from a predictable magnitude of hazard (which can be considered as the manifestation of the agent that produces the loss).’
A disaster occurs when a significant number of vulnerable people experience a hazard and suffer severe damage and/or disruption of their livelihood system in such a way that recovery is unlikely without external aid.3 By ‘recovery’ we mean the psychological and physical recovery of the victims, and the replacement of physical resources and the social relations required to use them.
Global trends and dynamic pressures
Although there is still a serious lack of analysis of the linkages between vulnerability and major global processes, it is encouraging that during the last ten years many more authors and institutions have begun asking such questions. For example, it is now possible to identify more precisely how urbanisation increases hazard impact (Mitchell 1999a; Fernandez 1999; Velasquez et al. 1999) (see below).
There is a general consensus in research on disasters that the number of natural hazard events (earthquakes, eruptions, floods or cyclones) has not increased in recent decades.15 If this is true, then we need to look at the social factors that increase vulnerability (including, but not only, rising population) to explain the apparent increases in the number of disasters (as opposed to hazard events) in terms of the value of losses and the numbers of victims.
Figure 2 2 shows the number of great disasters during the second half of the twentieth century. Some of the increase may be a result of better reporting and improved communications, or the incentive for governments to declare a disaster in an attempt to win foreign aid. But the rising trend seems to be too rapid for these explanations alone (see Box 2.3 below).
Disasters are also becoming more expensive. Economic losses, and especially the share composed of insured losses, are increasing (Figure 2.3).
At this stage, it is important to review in very broad terms how certain of these various dynamic pressures contribute to the increase in disasters. We have chosen seven global processes for further attention: population change, urbanisation, war, global economic pressures (especially foreign debt), natural resource degradation, global environmental change and adverse agrarian trends. These processes are not independent of each other. They are intricately connected in a series of mutually influencing relationships that obscure causes and consequences. Also, it should be remembered that some of these processes appear both as root causes and dynamic pressures: for example, past urbanisation and past war may set up patterns that influence vulnerability hundreds of years later (the decision by the Spanish in 1521 to locate what became Mexico City on the bed of a lake they had drained once their Aztec opponents were conquered; the Second World War that resulted in a new map of Europe). In these cases urbanisation and war can be considered root causes. However, recent or current urban growth and violent conflict should be seen as dynamic pressures.
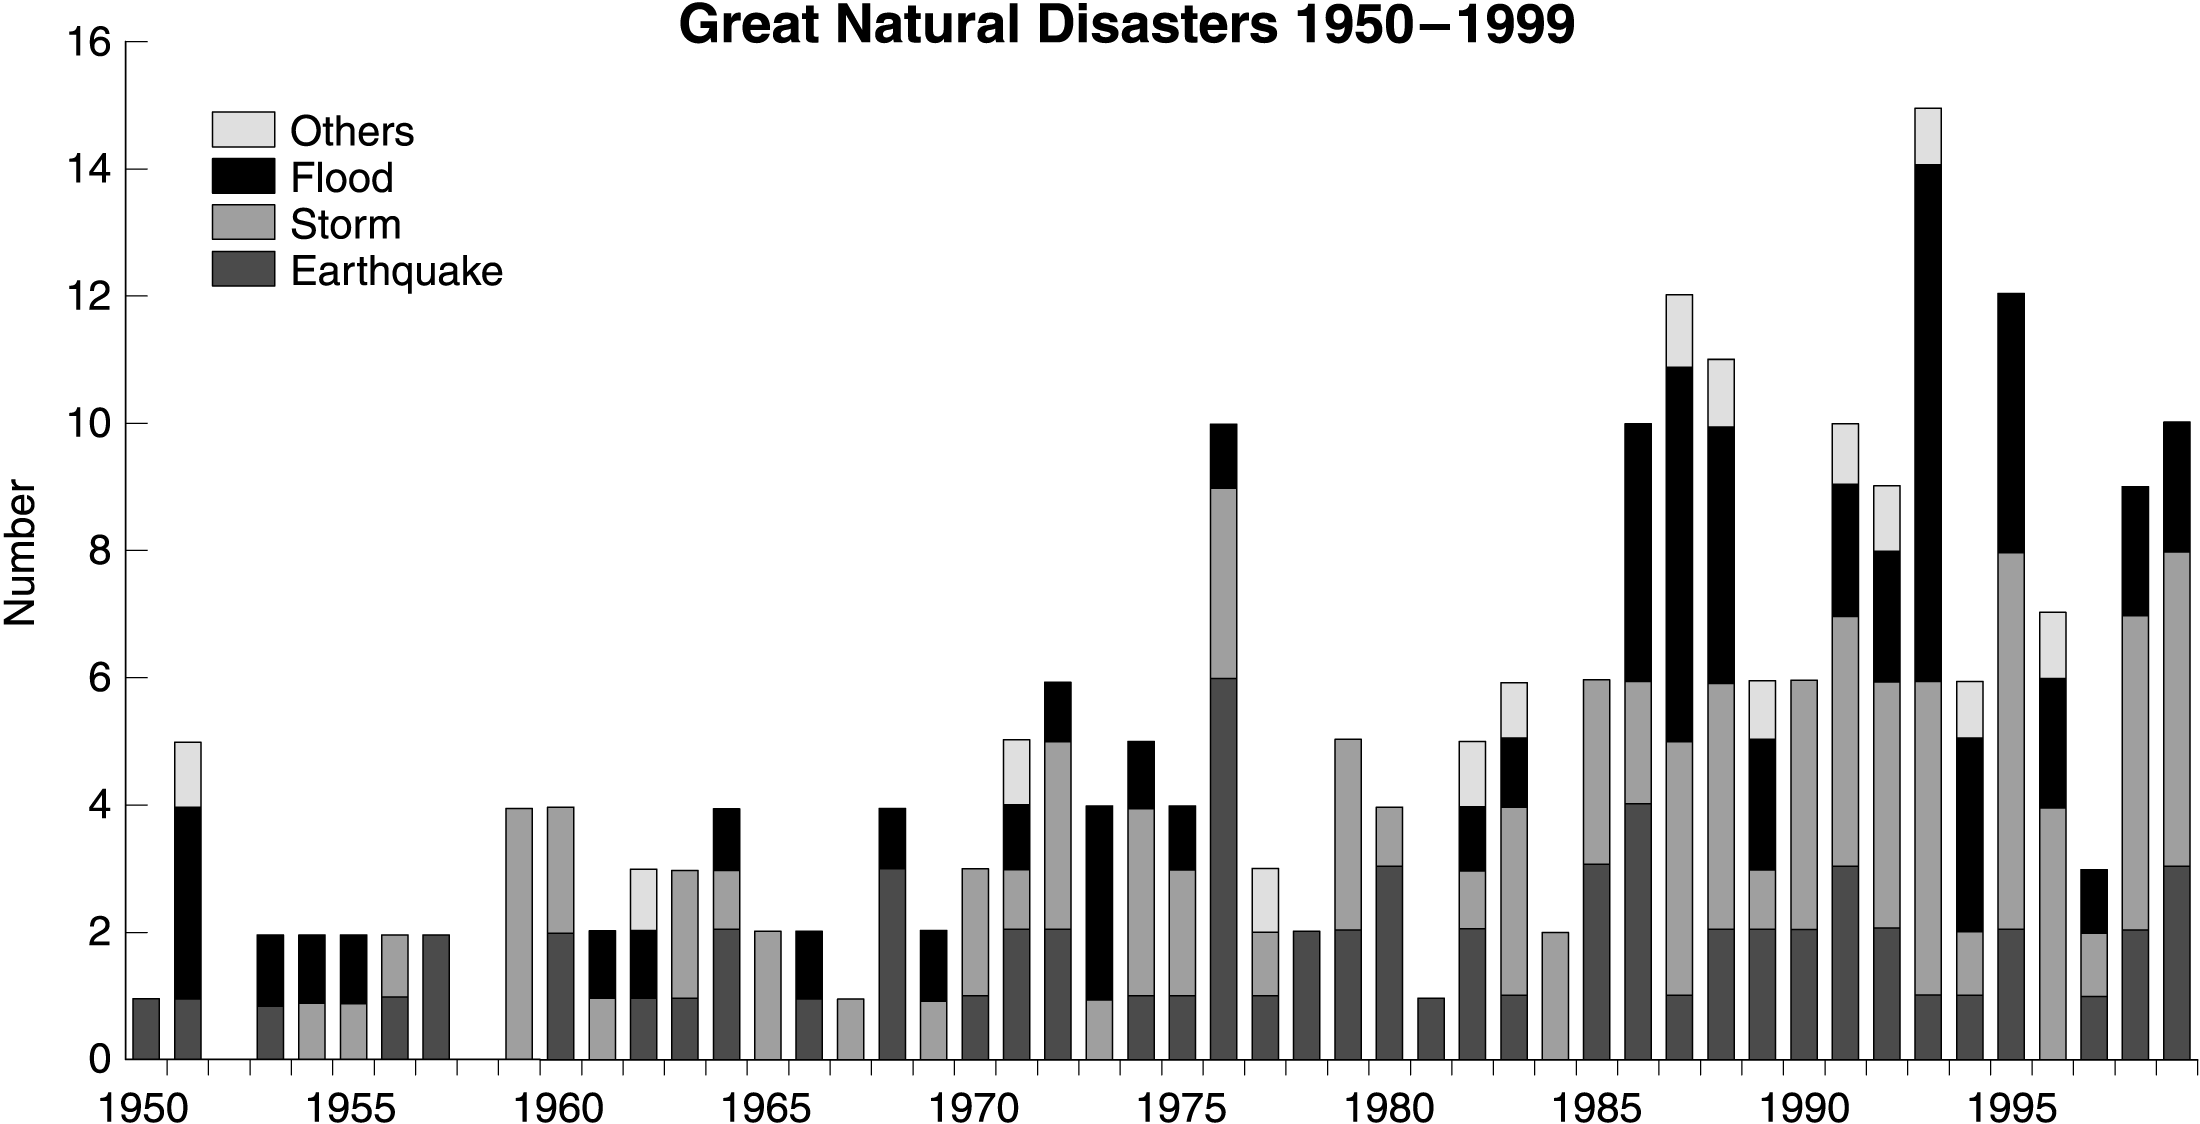
Figure 2.2 Numbers of great natural disasters 1950–1999
Note: The chart shows for each year the number of events defined as great natural catastrophes, divided up by type of event
Source: Munich Re. 2000. Great natural catastrophes – long-term statistics. Available online at http://www.munichre.com./pdf/pm_2000_02_29_anhang3_e.pdf Adapted by kind permission of Munich Re
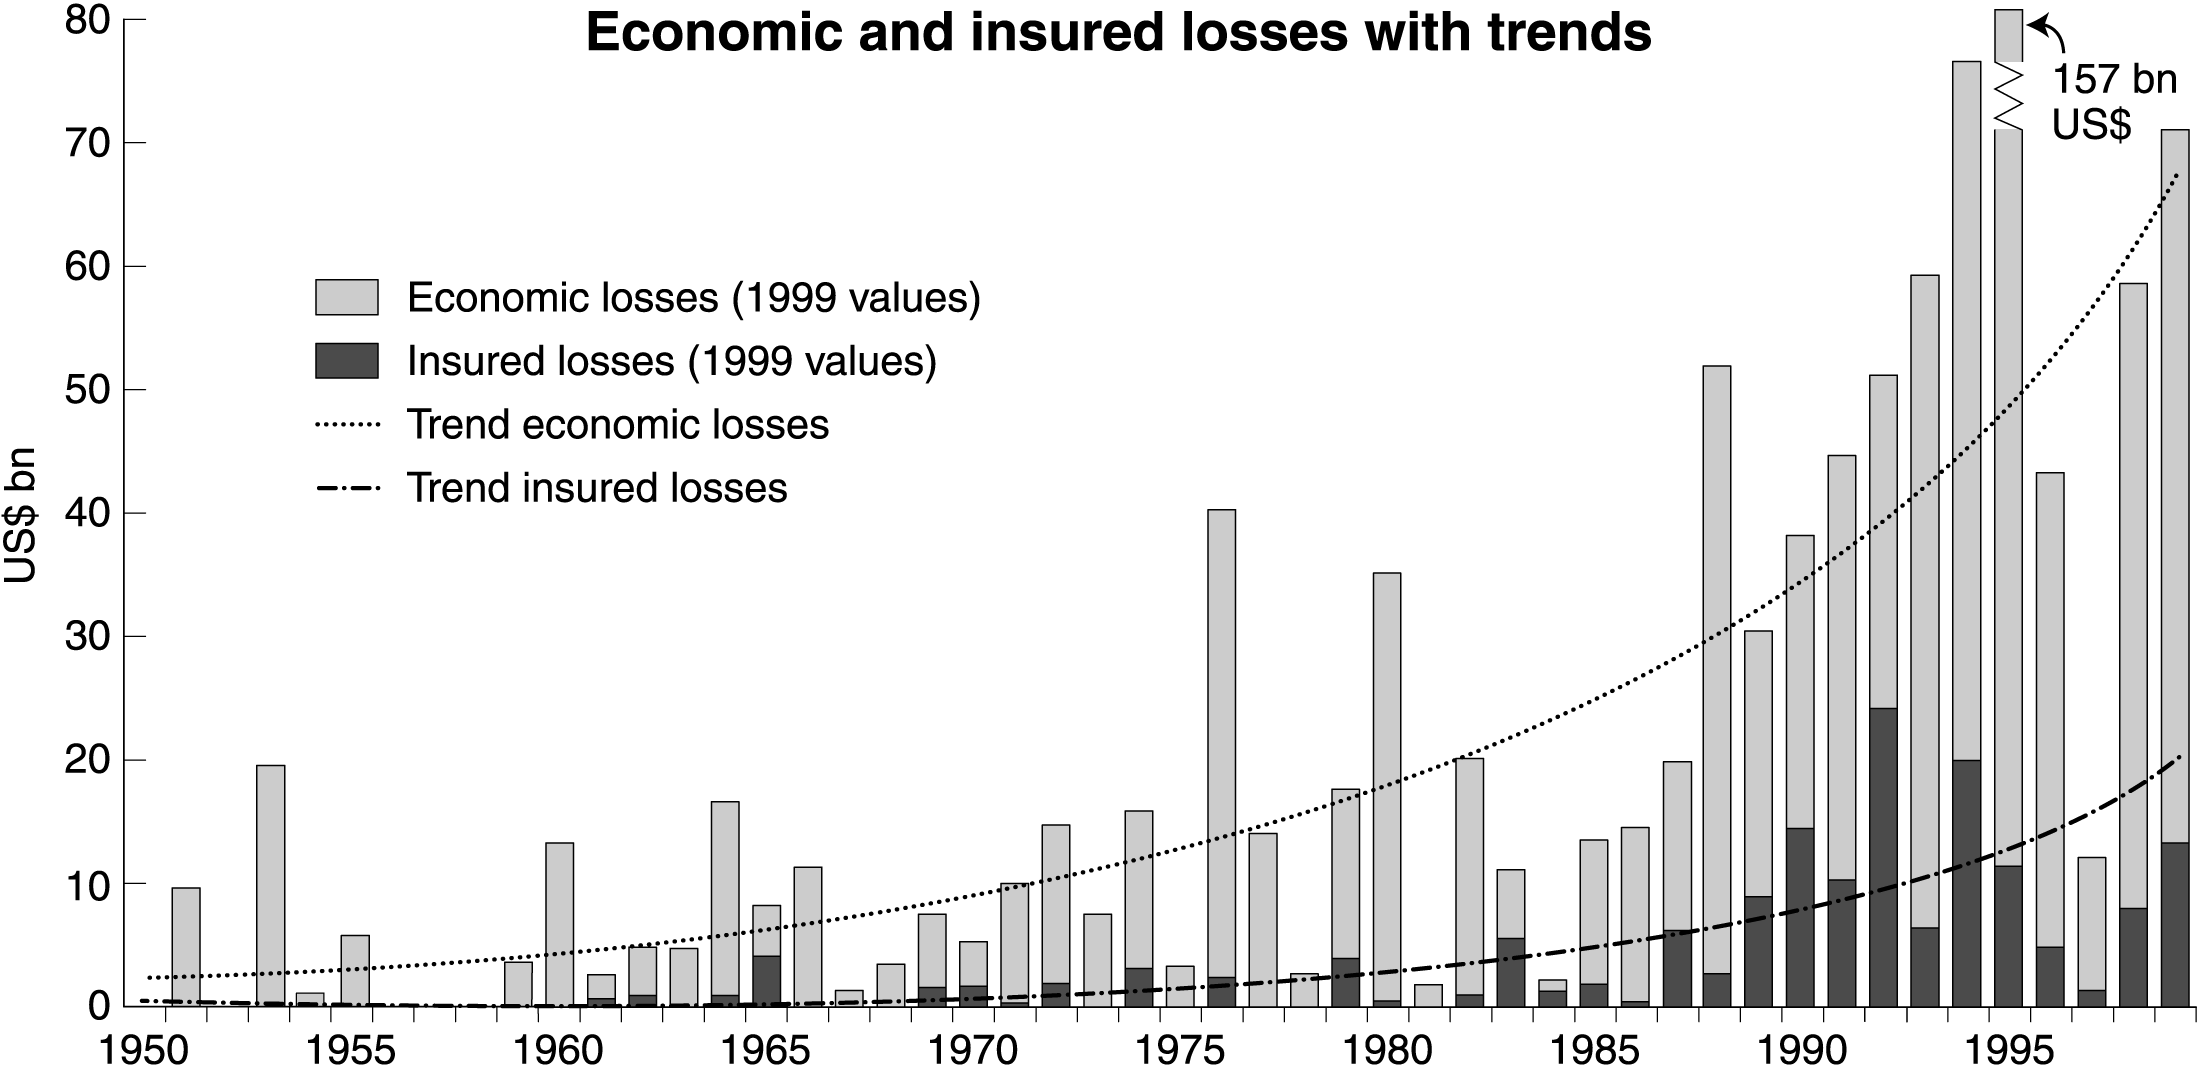
Figure 2.3 Economic and insured losses (with trends) for 1950–1999
Note: The chart presents the economic losses and insured losses – adjusted to 1999 values. The trend curves illustrate the alarming increase in catastrophic losses at the turn of the century
Source: Munich Re. 2000. Great natural catastrophes – long-term statistics. Available online at http://www.munichre.com./pdf/pm_2000_02_29_anhang3_e.pdf Adapted by kind permission of Munich Re
Box 2.3: Problems with disaster statistics
Where do disaster statistics come from?
As with worldwide health and population statistics, disaster statistics are reported by governments to United Nations agencies. These ‘official’ numbers are supplemented and cross-checked by some groups using the reports of non-governmental organisations (NGOs) and journalists. The preeminent of such institutions is the Centre for the Epidemiology of Disaster (CRED) in Belgium (http://www.cred.be ). Large reinsurance companies such as Munich Re and Swiss Re also compile international statistics on disasters. The World Bank and some of the UN regional economic commissions, such as the Economic Commission for Latin America (ECLA), have conducted studies of disaster loss and costs. Regional banks such as the Inter American Development Bank (IADB) and Asian Development Bank also study disaster statistics, but from the point of view of economic loss. The World Health Organisation (WHO) and Pan American Health Organisation (PAHO) do not maintain permanent registers of death, injury and post-disaster health consequences, but they do, on occasion, analyse and interpret such numbers.
How good are disaster statistics?
Like all numbers, disaster statistics are as good or bad as the methods used to collect them. Also disaster statistics have other specific weaknesses. Firstly, despite a large academic literature on the subject, there are no universally agreed definitions of the word ‘disaster’ (Quarantelli 1998) or other critical terms. One of the imprecise statistics often used by governments and aid organisations is the number of people ‘affected’ by a disaster. Since definitions of what it is to be ‘affected’ can vary so much, we do not use the number ‘affected’ at all in our book. ‘Injury’ is also a term that can have many meanings (Shoaf 2002; Benson 2002). The term ‘death’, too, can be problematic. For example, in the USA the death toll of the Northridge earthquake varies from 33 to 150+ depending on who defines what an earthquake-related death is: 33 died of direct or indirect earthquake injuries, 57 were defined by the LA County Coroner as dying of causes either directly or indirectly related to the earthquake; FEMA paid death benefits to survivors of more than 150 (Shoaf 2002).
Also, many extreme events that take only a few lives and affect only a local economy go completely unreported. This is an issue that a regional network of disaster researchers in Latin America have recognised by producing free, bilingual (English and Spanish) accounting software to be used to keep track of these ‘small’ disasters that could well have a highly erosive effect on development (http://www.desinventar.org/desinventar.html ).
Secondly, there may be deficiencies in the reporting system itself. Many injuries may go unreported or simply are not recorded by health workers who are too busy because of the volume of care demanded in an emergency. In some countries, or regions of a country, even in ‘normal’ times there may be poor coverage of vital statistics, with many births and deaths going unrecorded. This could happen in isolated rural areas as well as densely populated squatter settlements in cities. So, some people may die in an extreme natural event whose lives were not even officially recognised as existing. Others are never found, and are ‘missing’, but are never recorded as ‘dead’, even after a considerable period of time. There is also wide historical variability in disaster data. Davidson observes (2002), ‘This is because of changes in the methods of reporting, the number of people in an affected place, systems and facilities for storing records. This all makes efforts to track historical trends in disasters even more problematic than trying to account for impacts in a single event today. Plus, of course, most records are short compared to the return period of events.’
Thirdly, there can be political pressures either to overstate or to understate casualties. If a government wishes to ‘talk up’ the level of relief assistance, it might exaggerate the lives lost, homes destroyed, people injured. On the other hand, if a government believes it will be criticised by its citizens for not protecting them, there may be a tendency to understate the impacts of a disaster, or to remain silent about it altogether . However, in fairness, it is very difficult to collect data on losses and damage in a timely way when undergoing the stress of the disaster itself, especially if a country has limited transport and communications. The sheer difficulty of drawing up reliable estimates should therefore be considered a fourth reason why disaster statistics should be handled with care.
Finally, when it comes to economic loss and long-term effects on development, the problem is even murkier (Benson 2003). The longer term ‘knock on’ effects of a disaster are conceptually difficult to model, and in most cases governments are not set up to study them (Benson and Clay 1998). Davidson (2002) puts the problem this way: ‘[W]ith economic effects it’s difficult to assess which changes are caused by the disaster and which would have happened anyway. That is, there’s always the problem that it’s easier to compare before and after the disaster, but what we really should be comparing is with and without the disaster’.
