Normal Distributions
An Applied Example
Learning Objectives
Apply NORM.DIST and NORM.INV to solve an industry quality control problem.
In this section, we will explore a quality control example. For this quality control example, we will examine if the process is producing parts with enough consistency in the production.
Example 41.1
Problem Setup: You are purchasing a large batch of 20 centimeter (cm) nuts for your company from a manufacturer.
Before paying for the nuts – you perform quality control on the batch because you need these nuts to fit onto certain bolts in the product you are making.

Sampling: You take a sample of nuts and measure the diameter of each. In order to pass quality control, the sample can only have 5% of nuts smaller than 19.8 cm in diameter. Note: We will talk a lot more about sampling in the next section!
Results: In the sample of nuts that you gather, you find that the average diameter is 20.1cm with a standard deviation of 0.1cm.
Question: Will you accept this batch from the manufacturer?
Method #1 to Solve Problem (Exercise)
You Try: Let us first calculate the diameter that 5% of the nuts in our sample are smaller than. In order to do this, let us first choose the correct diagram we will use to solve this problem:
Next, let us pick the correct Excel command to solve for the [latex]x[/latex]-value in question:
Finally, let's draw a conclusion based off of our results:
Help to solve this problem? Click here for the Powerpoint slides. Click here for the Excel solutions. See below for the video solution and click below to reveal the written solutions.
Click here to reveal the written solutions for Method # 1
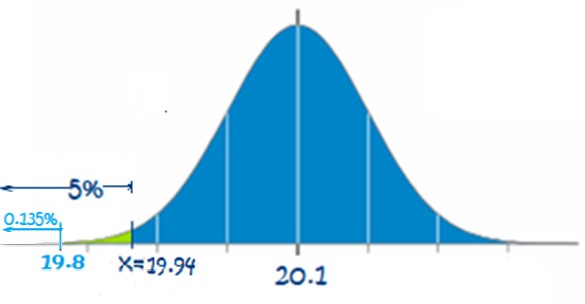
1) Let us first calculate the diameter that 5% of the nuts in our sample are smaller than. In order to do this, let us first choose the correct diagram we will use to solve this problem:
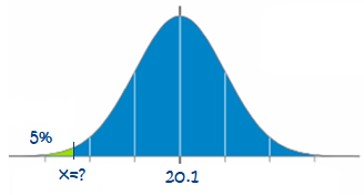
2) Second, let us determine the Excel formula to calculate the [latex]x[/latex]-value from the above diagram: \[ x = \text{NORM.INV}(0.05, 20.1, 0.1) = 19.93551 \]
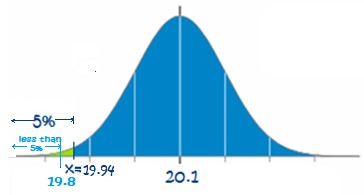
3) Finally, we can conclude that, because 19.93551cm is larger than the required 19.8cm limit, the nuts are large enough in diameter. Ie: More than 5% of the nuts are larger in diameter than 19.8cms and we can accept the batch of nuts from the manufacturer.
Method #2 to Solve Problem (Exercise)
You Try: Let us now solve the problem by determining the percent of nuts that have a diameter less than 19.8cm in the sample:
Next, let us pick the correct Excel command to solve for the [latex]x[/latex]-value in question:
Finally, let's draw a conclusion based off of our results:
Help to solve this problem? Click here for the Powerpoint slides. Click here for the Excel solutions. See below for the video solution and click below to reveal the written solutions.
Click here to reveal the written solutions for Method # 2
1) Let us first calculate the percent of nuts with a diameter less than 19.8 cms. In order to do this, let us first choose the correct diagram we will use to solve this problem:
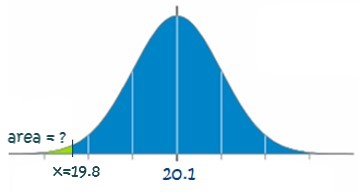
2) Second, let us determine the Excel formula to calculate the unknown area in the above diagram: \[ area = \text{NORM.DIST}(19.8, 20.1, 0.1, 1) = 0.00135 \]
3) Finally, we can conclude that, because 0.00135 = 0.135% is smaller than the limit of 5%, enough of the nuts are larger than the limit of 19.8cms in diameter. Ie: Less than 5% of the nuts are smaller in diameter than 19.8cms and we can accept the batch of nuts from the manufacturer.
Video Solution to This Section's Example
Accompanying Resources
- Click here to download the Powerpoint slides that accompany the video.
- Click here to download the Excel solutions for the Normal Distribution section.
Key Takeaways (EXERCISE)
Key Takeaways: Applied Example
Drag the words into the correct boxes for each section below:
Click the sections below to reveal the solutions to the above exercises
Your Own Notes (EXERCISE)
- Are there any notes you want to take from this section? Is there anything you'd like to copy and paste below?
- These notes are for you only (they will not be stored anywhere)
- Make sure to download them at the end to use as a reference
