Binomial Distributions
Binomial Distributions – At Most
Learning Objectives
Calculate the probability of at most [latex]x[/latex] number of successes.
If we want to calculate the probability of a range of x values using the formula:
- We need to add all possible probabilities together.
- Ex: [latex]P(\text{at most 2 sales})=P(x≤2)=P(x=0)+P(x=1)+P(x=2)[/latex]
If we want to calculate the probability of a range of x values using BINOM.DIST:
- Set 'cumulative' = TRUE (or 1)
- Ex: P(at most 2 sales) = P(x ≤ 2) = BINOM.DIST(2, [latex]n[/latex], p, TRUE)
total of All Possible Outcomes (Example)
Let us re-examine the salesperson problem:
- There are ten calls made in the day.
- This means that there are between 0 and 10 possible sales made in a day.
- What if we add up all of those possible probabilities?
- Let us examine this in the next example.
Example 26.1.1
Problem Setup: Again, let a salesperson call 10 clients in a day. Let the odds of the salesperson making a sale with any one of the clients be [latex]p[/latex]=0.3
Question: What is the probability that the salesperson makes between 0 and 10 sales in a day?
Solution: In the previous section, we found the probabilities for all possible number of sales:
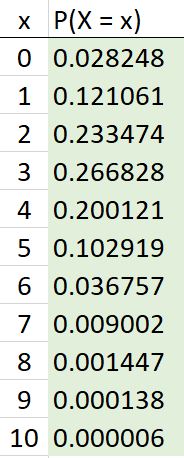
To calculate the probability of between 0 and 10 sales in the day, add up all these probabilities:
[latex]\begin{align*} P(0\le x\le10) &= P(x=0)+P(x=1) + P(x=2) + P(x=3) + ... + P(x=9) + P(x=10) \\ &= 0.02825+ 0.12106+0.23347+0.26683+0.20012+0.10292+0.03676+0.009+0.00145+0.00014+0.00001 \\ &= 1 \end{align*}[/latex]
Conclusion: There is a 100% chance that the salesperson makes between 0 and 10 sales in a day. Why is this? Because that range encompasses all the possible outcomes that can happen and we know that the sum of all possible probabilities in a probability distribution must equal to 1.
total of All Possible Outcomes in excel (Video)
- How would we do the calculation in the previous example in Excel?
- We would use Cumulative = TRUE or 1.
- Let us try this in the next example.
Example 26.1.2.
Problem Setup: We will use Excel's binom.dist call to calculate the probability of between 0 and 10.
Solution: Click here to download the Excel solutions. Also, see the video below:
Using the Formula to calculate 'At most' (example)
- Let us now consider the probability of at most a certain number of successes occurring.
- We denote 'at most' with a '≤' symbol.
- It can also be stated as 'less than or equal to.'
Example 26.2.1 – Using the Formula
Problem Setup: A hotel's records indicate that 5% of its guests are visitors from the U.S.A.
Question: From a random sample of 12 guests, what is the probability that at most one of them is from the U.S.A.?
Solution: We know the following:
- [latex]P(\text{at most one}) = P(x\le 1) = P(x=0) + P(x=1)[/latex]
- [latex]n=12[/latex] and [latex]p=0.05[/latex].
This gives:
- [latex]P(x=0) = {}_{12}C_0 \cdot (0.05)^0 \cdot (1 - 0.05)^{12-0} = \frac{12!}{0!12!} \cdot (0.05)^0 \cdot (0.95)^12 =1(1)(0.5404) = 0.5404[/latex]
- [latex]P(x=1) = {}_{12}C_1 \cdot (0.05)^1 \cdot (1 - 0.05)^{12-1} = \frac{12!}{1!11!} \cdot (0.05)^1 \cdot (0.95)^11 =12(0.05)(0.5688) = 0.34128[/latex]
- [latex]P(x\le1) = P(x=0)+P(x=1) = 0.5404+ 0.34128 = 0.8816[/latex]
Conclusion: There is an 88.16% chance that at most one of their guests is from the U.S.A.
Using Excel to calculate 'At Most' (EXample)
In Excel's BINOM.DIST function, when cumulative is set to TRUE (or 1):
- Excel calculates the probability of having up to and including [latex]x[/latex] ('number_s') successes.
- BINOM.DIST([latex]x[/latex], [latex]n[/latex], [latex]p[/latex], 1) = P([latex]X[/latex] ≤ [latex]x[/latex])
- Let us revisit example 26.2 to better understand this concept.
Example 26.2.2 – Using BINOM.DIST()
If we wanted to solve example 26.2 using Excel's BINOM.DIST() function:
P(x ≤ 1) = BINOM.DIST(1, 12, 0.05, 1) = BINOM.DIST(1, 12, 0.05, TRUE) = 0.8816
Click here to download the Excel solution file for the above problem.
Key Takeaways (EXERCISE)
Key Takeaways: Binomial Distributions - At Most
Your Own Notes (EXERCISE)
- Are there any notes you want to take from this section? Is there anything you'd like to copy and paste below?
- These notes are for you only (they will not be stored anywhere)
- Make sure to download them at the end to use as a reference
