Normal Distributions
Learning Objectives
Understand the shape, statistical properties and formulas for Normal Distributions.
Properties of Normal Distributions
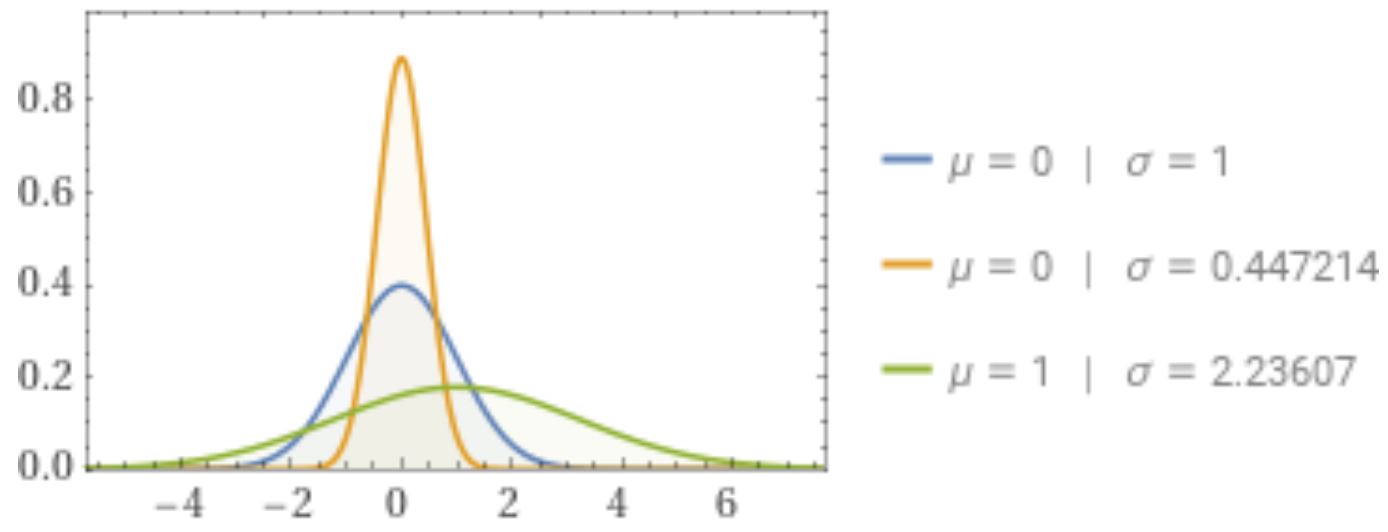
A normal distribution is:
- The most common type of distribution
- It is continuous and has a “bell” shape.
- It is 'symmetric' about the mean (µ) (see more in the 'SYMMETRIC' section)
- The total area under the normal curve is 1.
- Ie: the probability of being anywhere on the distribution=1.
Calculating Probabilities
It would require a calculate technique called Integration by Parts to calculate the probabilities by hand for the Normal Distribution. For this reason, we will only use Excel's NORM.DIST() function to calculate probabilities:
- [latex]P[/latex](at most or less than) =NORM.DIST([latex]x[/latex], µ, σ, TRUE)
- [latex]P[/latex](at least or more than) =1−NORM.DIST([latex]x[/latex], µ, σ, TRUE)
- Where µ (mu) is the mean of the distribution and σ (sigma) is the standard deviation.
Calculating X-Values
If we are looking to solve for the [latex]x[/latex]-value instead of the probability, this is called an 'inverse' problem and we use Excel's NORM.INV() function:
- [latex]x[/latex] = NORM.INV(Area to left of [latex]x[/latex], µ, σ)
- [latex]x[/latex] = NORM.INV(1− Area to right of [latex]x[/latex], µ, σ)
Z-Scores
A z-score is:
- "A statistical measurement that describes a value's relationship to the mean of a group of values."
- "Measured in terms of standard deviations from the mean."
- "A measure of an instrument's variability and can be used by traders to help determine volatility."
It can be calculated using a formula if the [latex]x[/latex]-value, µ (mu) and, σ (sigma) are given:
\[z = \frac{x-\mu}{\sigma}\]
It can be calculated using Excel's NORM.S.INV function if the area/probability is given: \[ z = \text{NORM.S.INV}(\text{Area to left of z}) = \text{NORM.S.INV}(1-\text{Area to right of z})\]
Symmetric Property
- It is symmetric (or identical) on either side of the mean.
- The mean and median are equal.
- The data in this distribution is neither skewed left nor skewed right.
Statistical Properties
The following metrics apply to Normal Distributions:
- population mean = µ
- sample mean = x̄
- population standard deviation = σ
- sample standard deviation = s
- mode = µ or x̄ (depending if population or sample given)
- variance = σ2 or s2 (depending if population or sample given)
- symmetric (not skewed) and the skewness = 0
Video & Resources Explaining Normal Distributions
Additional Resources:
- Click here to download the Powerpoint slides that accompany the video.
- Click here to download the Excel solutions for the Normal Distribution section.
Key Takeaways (EXERCISE)
Key Takeaways: Normal Distributions
Drag the words into the correct boxes for each section below:
Click the sections below to reveal the solutions to the above exercises
Your Own Notes (EXERCISE)
- Are there any notes you want to take from this section? Is there anything you'd like to copy and paste below?
- These notes are for you only (they will not be stored anywhere)
- Make sure to download them at the end to use as a reference
