10 Group Identification and The Brain
The own race bias describes the phenomenon whereby individuals are faster at recognising members of their own race than those of other races (Malpass & Kravitz, 1969). This effect can be, in part, explained by environmental exposure whereby individuals,on a day-to-day basis, experience greater exposure to members of their own race. Supporting such a hypothesis is the finding that the part of the brain that is involved with recognising faces (the fusiform face area) is more active when viewing faces of one’s own race compared to other-race faces (see Golby, Gabrieli, Chiao, & Eberhardt, 2001). Bernstein and colleagues (2007), interestingly, found the own race bias effect using the minimal group paradigm (where participants recognized faces of their minimal ingroup faster than faces in the minimal outgroup). Having found such an effect highlights the powerful role that social categorization plays in responding to people who are part of our ingroup compared to those who are in outgroups. As such, the question stands: do own race biases stem from familiarity with ingroup members or from categorization processes?
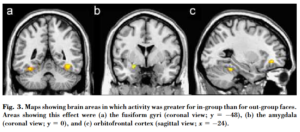
Van Bavel, Packer, and Cunningham (2008) showed white participants photographs of two mixed-race sports teams, the Tigers and the Leopards. They asked participants to imagine that they were a member of one of the teams (for example, the Tigers). Participants were asked to rate and memorize the faces of each of the members from of both teams. If the fusiform face area were activated more greatly when race ingroup faces were shown (for white faces in both the team ingroup and outgroup), this would lend support to the idea that the own race bias stems from extended exposure to ingroup faces throughout the life span. If the fusiform face area, however, were to activate more when the team ingroup faces were shown (regardless of team-member race), this would lend support to categorization processes being more important in processing stimuli. Their results provided evidence for the categorization explanation – participants showed greater activation in the fusiform face area when ingroup team member faces were seen regardless of their race, compared to outgroup team member faces. Moreover, participants rated white and black ingroup team members significantly more positively compared to white and black outgroup team members. These positivity ratings correlated strongly with activation in the orbitofrontal cortex –a part of the brain that pairs positive stimuli with positive experiences.
The amygdala has been shown to play an important role in facial recognition (Fitzgerald, Angstadt, Jelsone, Nathan, & Phan, 2006), especially when those faces display the emotion fear (LeDoux, 1996; Morris et al., 2001). Several lines of research confirm a relationship between activation of the amygdala when viewing outgroup faces (Amadio, 2003; Hart et al., 2000; Liebermanet al., 2005; Phelps et al., 2000; Wheeler & Fiske, 2005). Interestingly, Cunningham and colleagues (2004) showed white participants pictures of black and white faces at either 30ms or 525ms. They found greater activation in the amygdala when black (but not white) faces were shown for 30ms. The difference in activation in the amygdala was significantly reduced when the black faces were shown for 525ms. When black faces were shown for 525ms, participants showed a significant increase in the part of the frontal cortex that deals with control and emotional regulation. This suggests that processes of control activate to regulate more automatic evaluations.
