Chapter 3: Graphing
3.1 Points and Coordinates
Often, to get an idea of the behaviour of an equation or some function, a visual representation that displays the solutions to the equation or function in the form of a graph will be made. Before exploring this, it is necessary to review the foundations of a graph. The following is an example of what is called the coordinate plane of a graph.
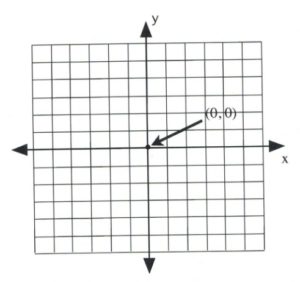
The plane is divided into four sections by a horizontal number line ( -axis) and a vertical number line (
 -axis). Where the two lines meet in the centre is called the origin. This centre origin is where
  and
and  and is represented by the ordered pair
  .
.
-axisFor the -axis, moving to the right from the centre 0, the numbers count up, and  To the left of the centre 0, the numbers count down, and
-axisSimilarly, for the -axis, moving up from the centre 0, the numbers count up, and  Moving down from the centre 0, the numbers count down, and
When identifying points on a graph, a dot is generally used with a set of parentheses following that gives the -value followed by the -value. This will look like  or
or  and is given the formal name of an ordered pair.
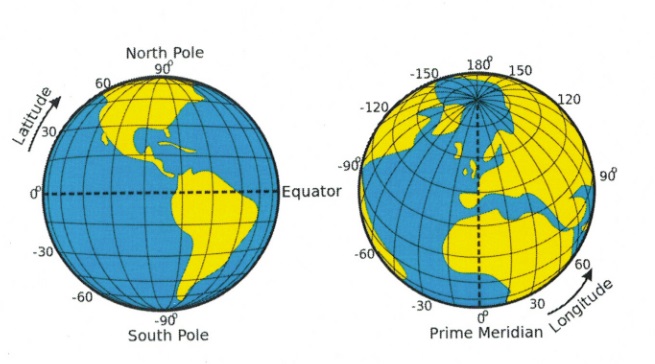
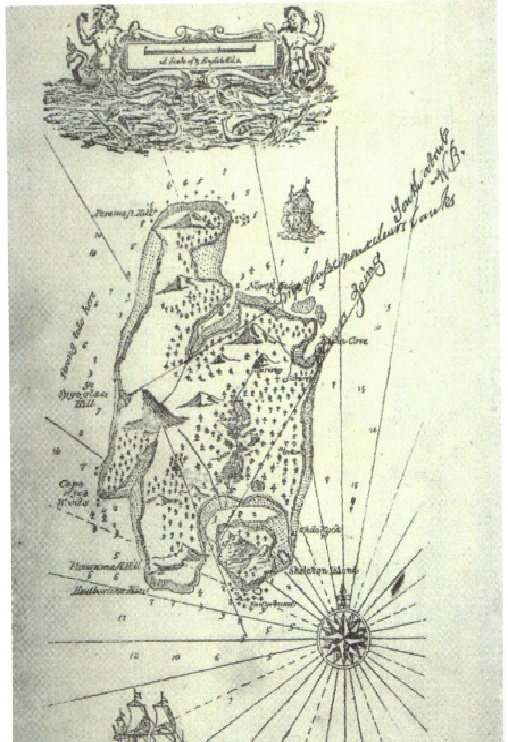
This coordinate system is universally used, with the simplest example being the kind of treasure map that is usually encountered in childhood, or the longitude and latitude system used to identify any position on the Earth. For this system, the -axis (which represents latitude) is the equator and the -axis (which represents longitude) or the prime meridian is the line that passes though Greenwich, England. The origin of the Earth’s latitude and longitude (0°, 0°) is a fictional island called “Null Island.”
Example 3.1.1
Identify the coordinates of the following data points.
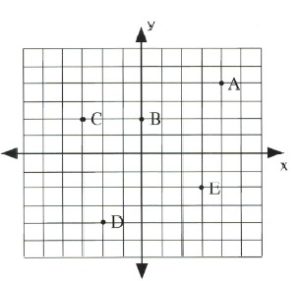
 For the -coordinate, move 4 to the right from the origin. For the -coordinate, move 4 up. This gives the final coordinates of (4, 4).
 For the -coordinate, stay at the origin. For the -coordinate, move 2 up. This gives the final coordinates of (0, 2).
 For the -coordinate, move 3 to the left from the origin. For the -coordinate, move 2 up. This gives the final coordinates of (−3, 2).
 For the -coordinate, move 2 to the left from the origin. For the -coordinate, move 4 down. This gives the final coordinates of (−2, −4).
 For the -coordinate, move 3 to the right from the origin. For the -coordinate, move 2 down. This gives the final coordinate of (3, −2).
Example 3.1.2
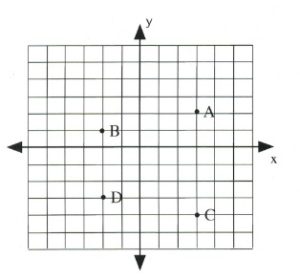
Graph the points A(3, 2), B(−2, 1), C(3, −4), and D(−2, −3).
The first point, A, is at (3, 2). This means  (3 to the right) and
  (up 2). Following these instructions, starting from the origin, results in the correct point.
The second point, B(−2, 1), is left 2 for the -coordinate and up 1 for the -coordinate.
The third point, C(3 ,−4), is right 3, down 4.
The fourth point, D(−2, −3), is left 2, down 3.
Questions
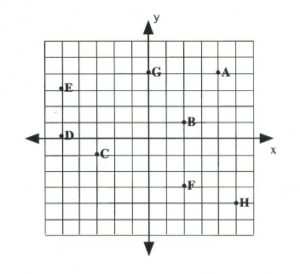
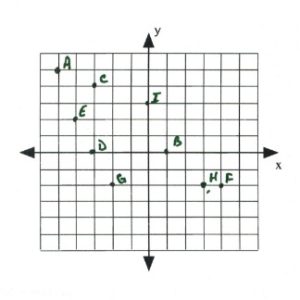
- What are the coordinates of each point on the graph below?
- Plot and label the following points on the graph.

Long Descriptions
Latitude and longitude long description: Two views of the globe that show the landmark points of the latitude and longitude system.
The first globe demonstrates the lines of latitude. The centre line of latitude is called the equator and represents 0° latitude. It wraps around the centre of the Earth from west to east. The globe shows North and South America, and the equator runs through the northern part of South America. The North Pole is at 90° latitude and the South Pole is at −90° latitude. Positive latitude is above the equator, and negative latitude is below it.
The second globe demonstrates the lines of longitude. The centre line of longitude is called the prime meridian and represents 0° longitude. It wraps around the centre of the Earth from north to south. It passes through Greenwich, England, by convention, as well as parts of France, Spain, and western Africa. Positive longitude is east of the prime meridian, and negative longitude is west of it. [Return to Latitude and longitude]
