Chapter 4: Inequalities
4.4 2D Inequality and Absolute Value Graphs
Graphing a 2D Inequality
To graph an inequality, borrow the strategy used to draw a line graph in 2D. To do this, replace the inequality with an equal sign.
Example 4.4.1
Consider the following inequalities:
![\[\begin{array}{rrrrr} 3x&+&2y&<&12 \\ 3x&+&2y&\le &12 \\ 3x&+&2y&>&12 \\ 3x&+&2y&\ge &12 \end{array}\]](https://pressbooks.bccampus.ca/intermediatealgebrakpu/wp-content/ql-cache/quicklatex.com-d6c622cf704556c16c35864f0683b13d_l3.png "Rendered by QuickLaTeX.com")
All can be changed to  by replacing the inequality sign with =.
It is then possible to create a data table using the new equation.
Create a data table of values for the equation 
 |
 |
|---|---|
| 0 | 6 |
| 2 | 3 |
| 4 | 0 |
| 6 | −3 |
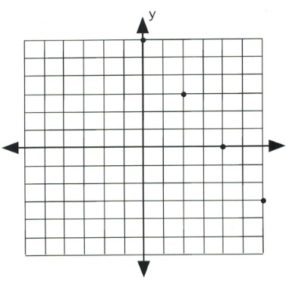
Using these values, plot the data points on a graph.
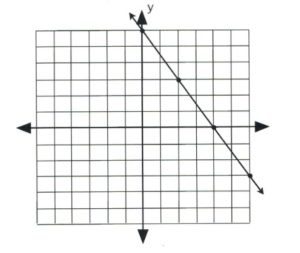
Once the data points are plotted, draw a line that connects them all. The type of line drawn depends on the original inequality that was replaced.
If the inequality had ≤ or ≥, then draw a solid line to represent data points that are on the line.
![]()
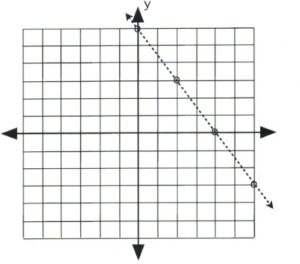
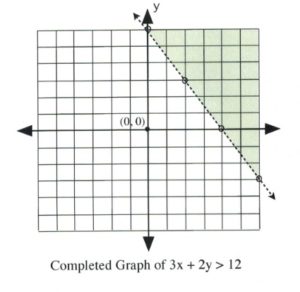
If the inequality had < or >, then draw a dashed line instead to indicate that some data points are excluded.
![]()
If the inequality is either  or
or  , then draw its graph using a solid line and solid dots.
If the inequality is either  or
or  , then draw its graph using a dashed line and hollow dots.
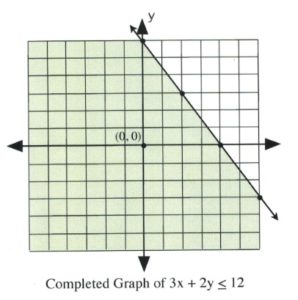
There remains only one step to complete this graph: finding which side of the line makes the inequality true and shading it. The easiest way to do this is to choose the data point  .
.
It is evident that, for  and
and  , the data point is true for the inequality. In this case, shade the side of the line that contains the data point .
It is also clear that, for  and
and  , the data point is false for the inequality. In this case, shade the side of the line that does not contain the data point .
Graphing an Absolute Value Function
To graph an absolute value function, first create a data table using the absolute value part of the equation.
The data point that is started with is the one that makes the absolute value equal to 0 (this is the -value of the vertex). Calculating the value of this point is quite simple.
For example, for  , the value
  makes the absolute value equal to 0.
Examples of others are:
![\[\begin{array}{rrrrrrrrr} |x&+&2|&=&0&\text{when}&x&=&-2 \\ |x&-&11|&=&0&\text{when}&x&=&11 \\ |x&+&9|&=&0&\text{when}&x&=&-9 \\ \end{array}\]](https://pressbooks.bccampus.ca/intermediatealgebrakpu/wp-content/ql-cache/quicklatex.com-ede2cb623492e434a069d22befdc2de5_l3.png "Rendered by QuickLaTeX.com")
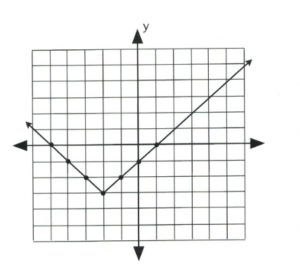
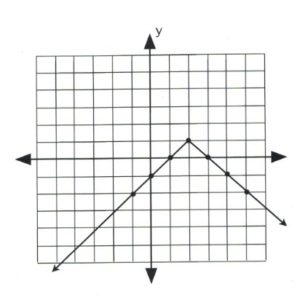
The graph of an absolute value equation will be a V-shape that opens upward for any positive absolute function and opens downward for any negative absolute value function.
Example 4.4.2
Plot the graph of 
The data point that gives the -value of the vertex is  in which
  This is the first value.
For  which yields
Now pick -values that are larger and less than −2 to get three data points on both sides of the vertex, 
|
|
|---|---|
| 1 | 0 |
| 0 | −1 |
| −1 | −2 |
| −2 | −3 |
| −3 | −2 |
| −4 | −1 |
| −5 | 0 |
Once there are three data points on either side of the vertex, plot and connect them in a line. The graph is complete.
Example 4.4.3
Plot the graph of 
The data point that gives the -value of the vertex is  in which
  This is the first value.
For  which yields
Now pick -values that are larger and less than 2 to get three data points on both sides of the vertex, 
|
|
|---|---|
| 5 | −2 |
| 4 | −1 |
| 3 | 0 |
| 2 | 1 |
| 1 | 0 |
| 0 | −1 |
| −1 | −2 |
Once there are three data points on either side of the vertex, plot and connect them in a line. The graph is complete.
Questions
For questions 1 to 8, graph each linear inequality.


For questions 9 to 16, graph each absolute value equation.


