8. PUBLIC SPEAKING
8.3 Using Visual Aids
Even the most dynamic speakers make use of visual aids to accompany their presentation and help illustrate their ideas. Graphic elements not only add interest, they tap into the brain’s visual cortex, a powerful learning centre, helping to cement understanding. In short, relevant, well-designed visual images gain and hold the audience’s attention, enhance their understanding of complex information, and provide a structure to keep you on track.
For planning and designing slide presentations, therefore, Dr. Mike Alley, an engineering professor at Penn State University, specifically identifies graphics as more important than text when using PowerPoint. Alley offers an Assertion-Evidence template, asserting that PowerPoint functions best as a visual platform, with textual content – words – being best reserved for the talk itself. To learn more about Dr. Alley’s approach to technical presentations, you can follow along with the Assertion-Evidence slide tutorial offered on his Penn State website.
Whether using a slide deck, infographic, mockup design, or simply “show and tell,” visuals should be used to supplement what you’re saying, not take over. Your audience should look at the visuals when you cue them to do so, but otherwise, the audience should be focused on the person presenting the ideas. The key concept to remember is that visuals should serve a clear and useful purpose.
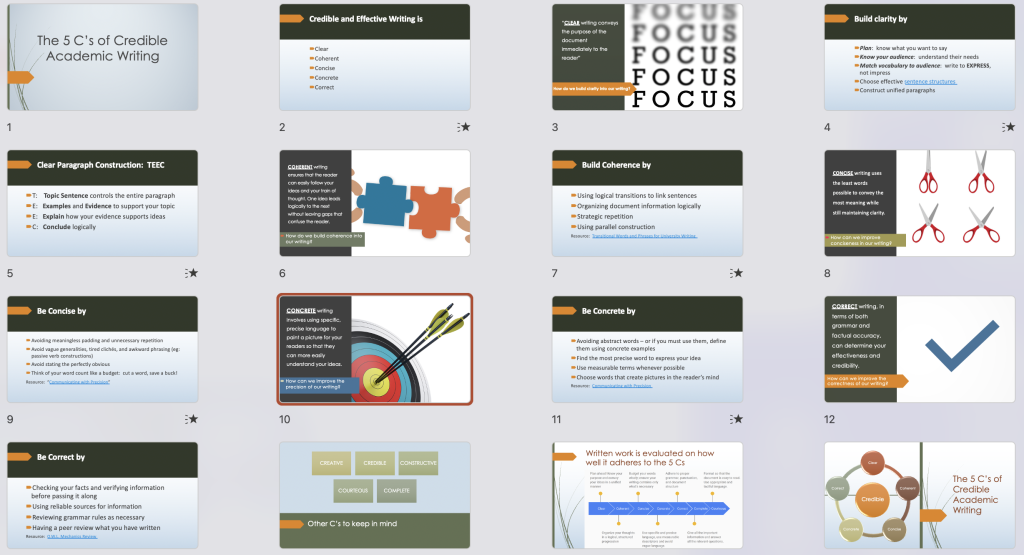
PowerPoint Terminology
PowerPoint is probably the most common form of visual aid used in presentations, so there is a lot of information that focuses on the pros and cons of this medium. Indeed, an internet search of “death by PowerPoint” brings up a myriad of results! Nevertheless, PowerPoint is a standard workplace tool, so it would be wise to gain proficiency with it.
Well-designed visuals offer a powerful way for beginners and those honing their skills to add interest and variety to their talks, so when designing a PowerPoint presentation, it’s helpful to be familiar with key terminology used to discuss the various elements. Here are a few terms to get started:
DECK: The slide deck is the entire presentation (all the slides in the presentation; see Figure 8.2.1).
GLOSS: what the speaker says about each slide is referred to as the “gloss.” As a presenter, refrain from directly reading text on a slide. A gloss consists of you elaborating on what’s shown on a slide in your own words. Ideally, slides should present minimal text, using key words and bullet points only, not full sentences, thus placing the emphasis on visuals. (Note, however, that “teaching slides” tend to include more text than “presentation slides,” as instructors assume that students might want to review the slides to prepare for exams or assignments.)
SLIDE: one “page” of a presentation (Figure 8.2.2 shows one slide from a deck) with the various elements identified.
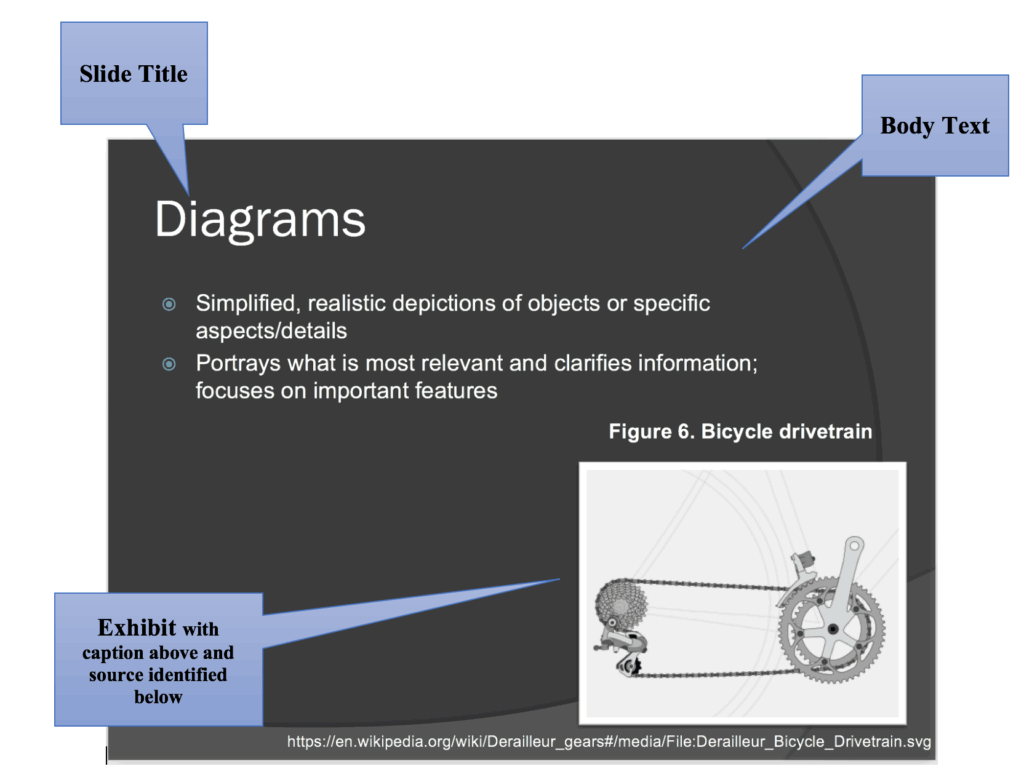
SLIDE TITLES: usually at the top of the slide, the title acts as a “heading” indicating the topic to be discussed in each slide. Not all slides need headings.
BODY TEXT: written text on the slide, often in the form of bullet points or key terms. This text should be kept to a minimum (key words/phrases; quotations you want to read out loud). Don’t write your “script” in the slide’s body text. An abundance of text distracts the audience, who may try to read and listen at the same time, and end up not comprehending effectively.
EXHIBITS: illustrative graphics on the slides that are glossed in the presentation. You should discuss graphics and data visualization to explain what is important about them – even if it seems obvious to you. Never present a graphic that you don’t actively describe and discuss in your gloss.
DECORATIVE GRAPHICS: Slide motifs, themes, and other non-essential images that add visual appeal to the slides, but do not illustrate substantive ideas. Be careful to avoid creating overly “busy” slides with distracting decorative designs.
NOTES: Underneath the slide, there is a section where you can write notes you want to cover in your gloss. The audience will not see the “notes” portion.
EXERCISE 8.2 – Reflect and Revise
Find a PowerPoint deck you recently created for a presentation and review your slide design. Maybe choose one slide in particular and identify the various elements described above. See where you might improve the slide design to adhere to the guidelines suggested and make the presentation more engaging for your audience.
For example, is there too much text? Can you whittle it down to a few key words, or even one, or better yet, an image that epitomizes your idea? Then you can write your speaking notes in the Notes section instead of on the slide.
Visual Rhetoric
PowerPoint is not the only visual medium you might use. Pamphlets, posters, infographics, billboards, and other kinds of displays can also help you convey your message if they are well designed. Considering how to present ideas visually can be as important as determining what to say. Here are some additional resources to help you design visual information in a rhetorically effective way:
Ch. 3.4 Visual Rhetoric: review this chapter for information on visual design principles and short illustrative videos on using typography, colour, images, layout and composition in strategic and persuasive ways.
Rule of Thirds (Wikipedia) – a common guideline for spacial composition of images
Design for Colour and Light Perception (Lois Frankel, Sense It! Insights into Multisensory Design, Ontario Pressbooks) offers information on basic colour theory, psychology of colour, and applying these ideas in your designs.
- Keithonearth, [Bicycle image embedded in slide]. [Online]. Available: https://en.wikipedia.org/wiki/Derailleur_gears#/media/File:Derailleur_Bicycle_Drivetrain.svg.CC BY-SA 3.0. ↵
